Knowledge Mappers is a digital mapping consultancy & publishing company with a unique mix of geographic & knowledge mapping expertise. Our ground-breaking products & services visually connect individuals, teams, organisations & communities with the knowledge resources that they need… to do what they need to do… quicker, easier, and with a lot less stress :-)
Professionally crafted & curated knowledge maps of real world & conceptual ‘spaces’ of human interest & endeavour. Like all maps, they are visually structured registers of the ‘things’ that define the ‘space’, and the ‘spatial’ relationships between them. But they are also registers of – and portals to – official / definitive / ‘plain old useful’ knowledge resources about those ‘things’ available in the public domain. Maps can be downloaded in both original MindManager (.mmap) and HTML5 format, and so can be viewed in any browser, on any device, without the need for adtitonal plugins.
The School Travel Health Check (STHC) Spatial Analysis Service is an example of a GI consultancy project for one local authority in 2004 that soon “grew arms and legs” to become a ground-breaking, nationally available service. It provides high quality, spatial intelligence to local authorities, school communities and other stakeholders interested in how children travel to school, from where, and how far they travel to get there.
Our other passion is combining that same unique range of data / information / knowledge hunting & cartographic expertise with Corel (formerly ‘Mindjet’) MindManager – the world’s best information (‘mind’) mapping software – to create multi-function knowledge maps (‘hierarchical tree diagrams’) that visually capture not only the various individual elements that make up just about any ‘knowledge space’ and the ‘spatial’ inter-relationships between them, but also the (potentially 1000’s of) official / definitive / plain old useful knowledge resources available about them in the public domain. So they are an interactive map, a visualy structured ‘discover within the bigger picture context’ index of online knowledge resources, and a ‘minimal-click’ portal to those resources all in one.
We began using MindManager to map the knowledge in our own ‘business space’ in 2002, but soon realised the technique could also be applied to mapping knowledge about the ‘real world geographic spaces’ with which we were familiar (or so we thought!), and then the everyday ‘time spaces’ that rule our lives. In fact we realised that we could use it to map – and bring clarity to – just about any ‘knowledge space’ that we humans have created to conceptually structure, physically manage and navigate our world on a day to day basis.
(Note you can see here an illustrated ‘walk through’ of the process of turning an official spreadsheet of information found in the online public domain into a visually structured knowledge map, taken from our ScotlandTheMap project).
Realising the value of these new ‘knowledge atlas’ and ‘knowledge calendar’ maps to everybody trying to build a better world (or at least their bit of it) – whilst simultaneously struggling with information overload and getting all the other stakeholders ‘on the same page’ – we decided to share them via our digital download map store, in both HTML5 and MindManager (.mmap) format. HTML versions (an export feature unique to MindManager) can be viewed by anybody using any modern browser, on any device, on or offline, without the need for any plugins, whilst anybody with access to MindManager software can use the original MindManager format maps as ‘ready made’ templates to amend, adapt & repurpose (in whole or in part) in their own projects so they do not have to re-invent the knowledge wheel each time. (MindManager is more usually famed for it’s rich feature set for project planning & execution.)
We also offer a bespoke knowledge mapping service for clients – especially for communities – as well as consultancy & training. Along with our fellow partners in the MindManager International Value Added Partner (MIVAP) Network we also offer a complete MindManager consultancy service to help others to get the most value from this most amazing digital tool.
The videos above give an overview of what our knowledge maps are, the different content elements and how to interact with them. These are taken from our Scotland The Map project.
New to our ground-breaking knowledge maps? Find out all about what they are, how to use them and the benefits they bring, in our map guide below. Please contact us directly if you still need more information…
Welcome to our digital download knowledge map store. Here you will find unique, ground-breaking knowledge maps that visually & virtually connect official / definitive / ‘plain old useful’ general, geographic & specialised knowledge resources about all the key ‘building blocks’ that we humans use to structure, and make sense of, the ‘real world’ we live in and have to manage on a day to day basis – for example geographic areas and their subdivisions in our World Atlas Maps, time and it’s sub-division into manageable chunks in our Annual Calendar Maps etc.
The knowledge our maps contain are of…
‘Building blocks’ – what ‘building blocks’ of which type make up a given ‘real world human knowledge space’, be they physical or conceptual.
Knowledge resources – what official / definitive / ‘plain old useful’ knowledge resources about said building blocks exist in the online public domain (ie. freely available).
Links – where those resources are online (ie. their URLs), so map users can access them ‘there and then’ with a click of their mouse.
Core contextual knowledge – core knowledge taken from said external resources and embedded / attached to the building block map branches using MindManager’s unique information cartography capabilities to enhance the user experience.
The visual & intuitive layout and richness of content of our maps makes existing knowledge resources (and knowledge gaps!) easier to discover (& re-discover), assess, understand & make use of, which in turn benefits users, creators, and the world as a whole. Individuals / organisations / communities / projects can spend more of their precious time & resources actually utilising the worlds existing knowledge bases so that they can do what they need to do to move forward as quickly and efficiently as they can, rather than wasting so much of them getting lost down internet search rabbit holes (or worse recreating resources that already exist).
In short, our knowledge maps are an interactive, visualy structured, intuitive to use, ‘discover within the bigger picture context’ index of the ‘building blocks’ that make up a given ‘human knowledge space’, the online knowledge resources about them, and a ‘minimal-click’ portal to those resources, all in one.
We create our maps using our unique mix of professional information hunting & cartography skills and MindManager, the world leading information mapping software.
Thanks to MindManger’s unique HTML export capability, we can make our ground-breaking knowledge maps available to download in 2 formats….
Original MindManager (.mmap) format – for full featured viewing, interactive querying, editing, expanding, adapting and re-purposing in whole or in part by MindManager software users.
HTML5 (.html) format – all the content – and most of the interactivity – of the original MindManager map (but ‘view only’), viewable on any any modern browser, on any device, without the need for any plugins, or indeed an internet connection to view it once it has been downloaded (so it can be viewed offline, in remote locations with no signal).
We welcome your feedback & suggestions for subjects for future maps, or other definitive / official / plain old useful 🙂 knowledge resources to link to (as long as they’re freely accessible in the public domain). We are also keen to collaborate with like minded organisations, communities & projects for the benefit of the common good.
As far as we are aware we are the only company in the world creating and publishing public domain knowledge maps in this way, as well as offering a ‘done for you’ service for clients, as well as training & consultancy services to help them do it for themselves.
Our knowledge maps are built from 2 different sorts of components that together, we hope you agree, make something that is much greater than the sum of it’s individual parts…
The framework of the knowledge map is made up of interconnected branches – of varying colours, shapes, and sizes, which are arranged in a visually connected hierarchy around a central topic. There are different ‘types’ of branches within our knowledge maps (though the types are not all mutually exclusive).
Each branch in the map has a mix of elements – often unque to MindManger – embedded within, or attached to, it and/or has some other physical attribute, that conveys core knowledge, or link to primary knowledge resources, about the ‘real world building block’ the branch represents.
Find out more below…
The framework of the knowledge map is made up of interconnected branches (of varying colours, shapes and sizes), which are arranged in a visually connected hierarchy around a central topic. There are different ‘types’ of branches within our knowledge maps (though the types are not all mutually exclusive)…
.
Central topic
Contains the map title, publishing details and a central image.
.
Main framework branches
The next one or two levels of branches define the layout of the map, in 2 different ways…
.
Knowledge Seed branches
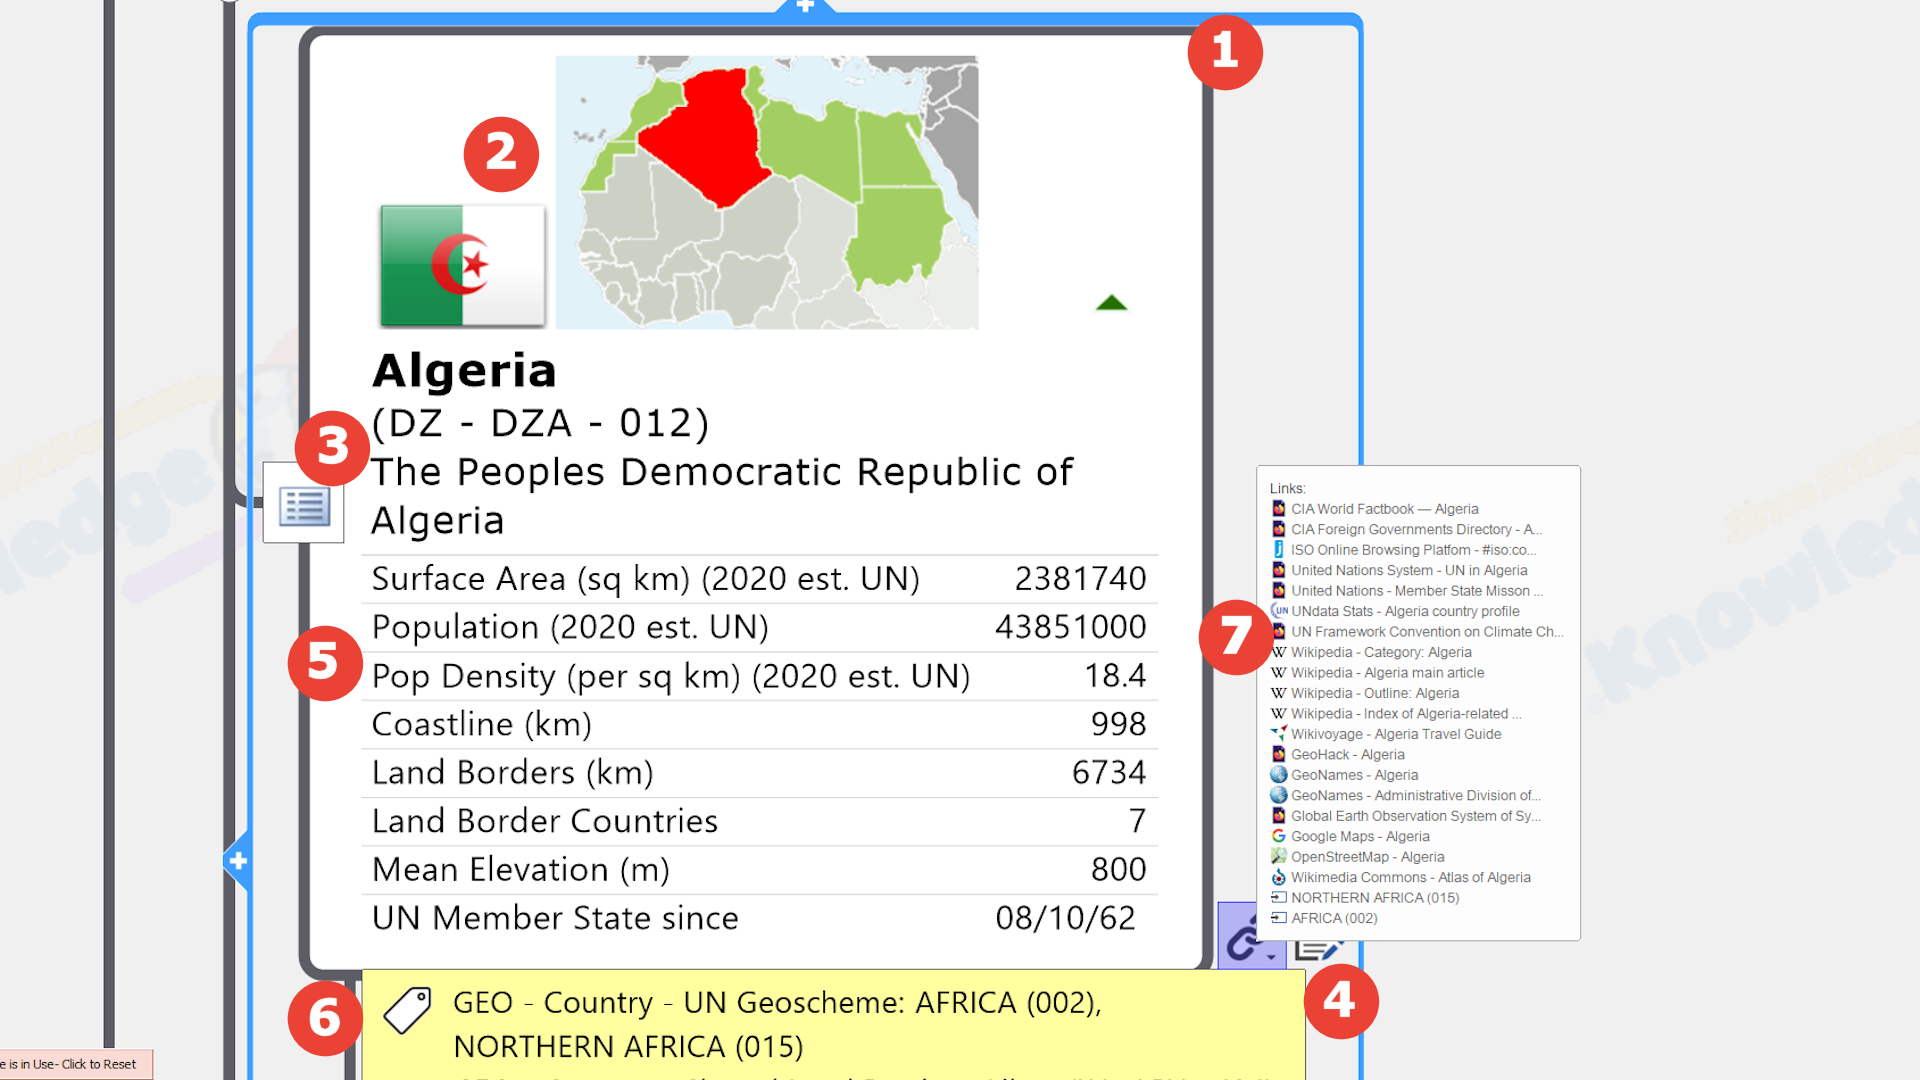
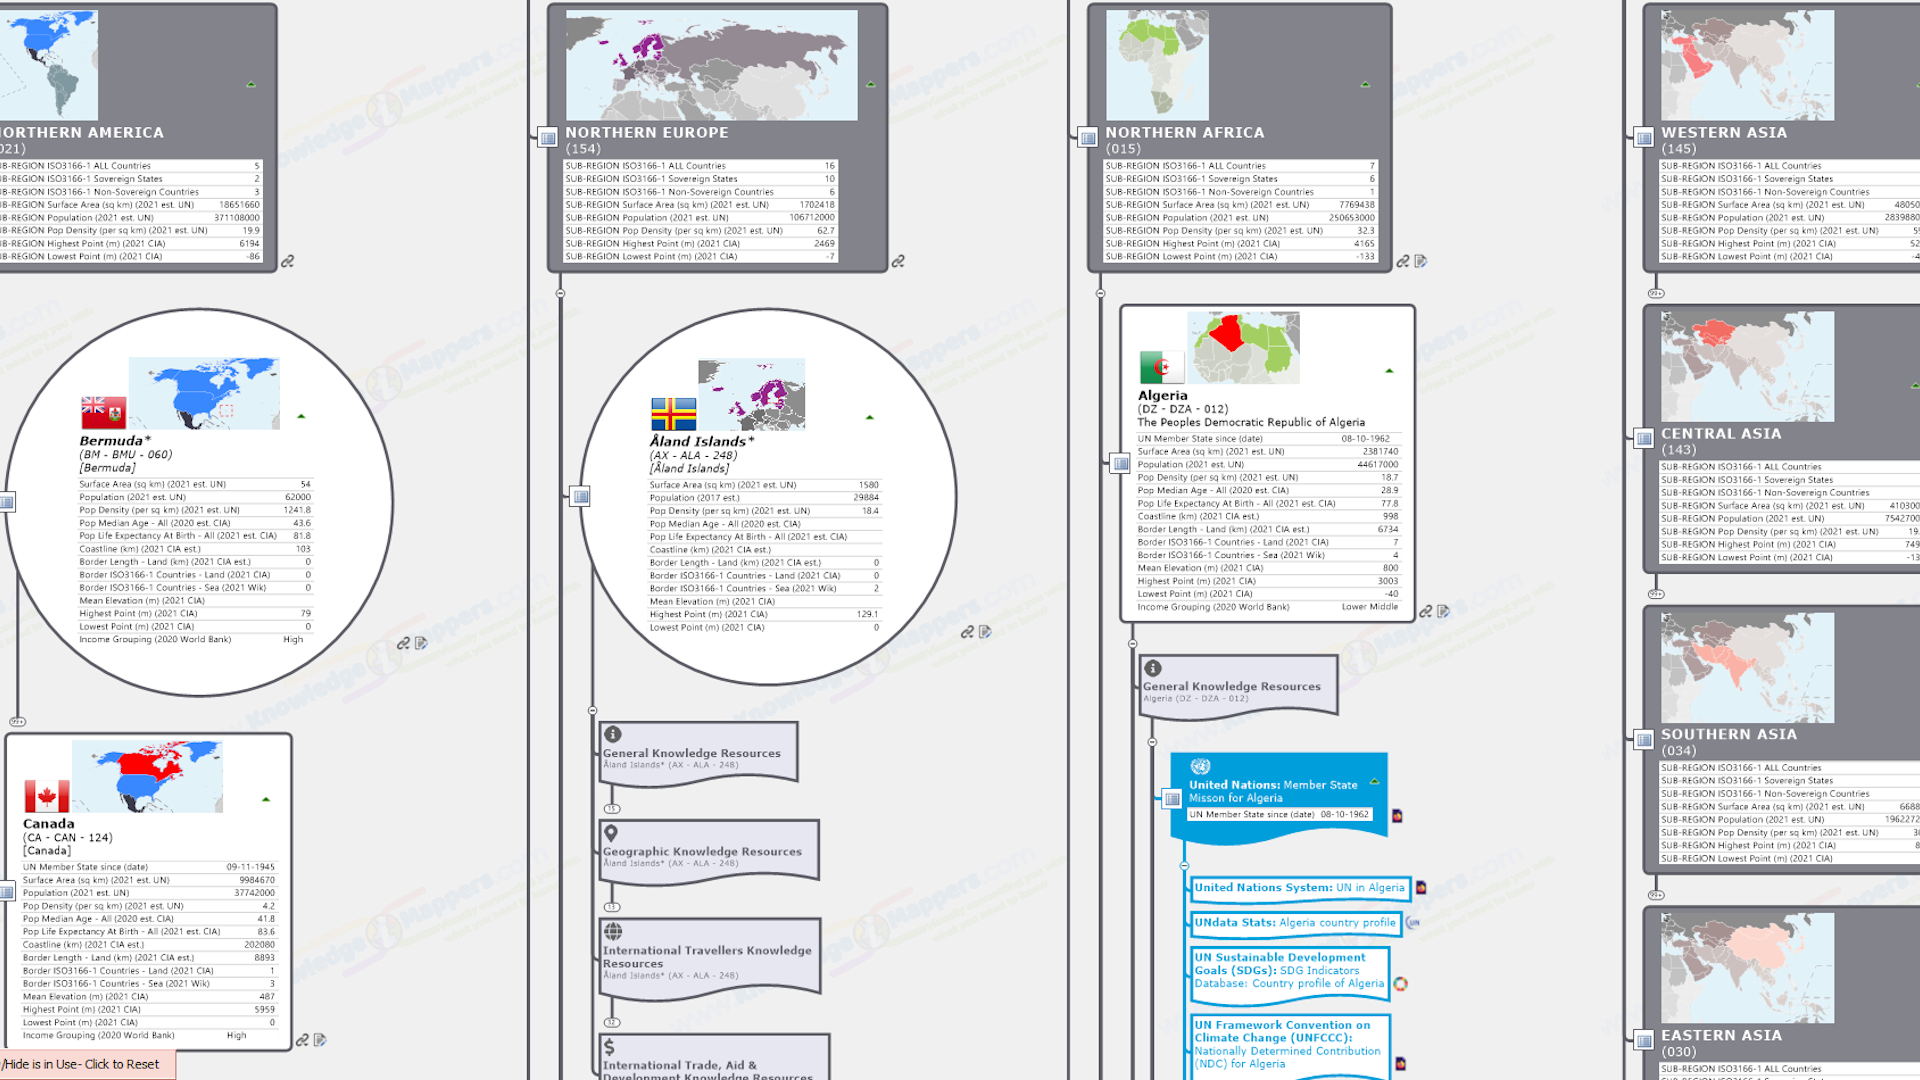
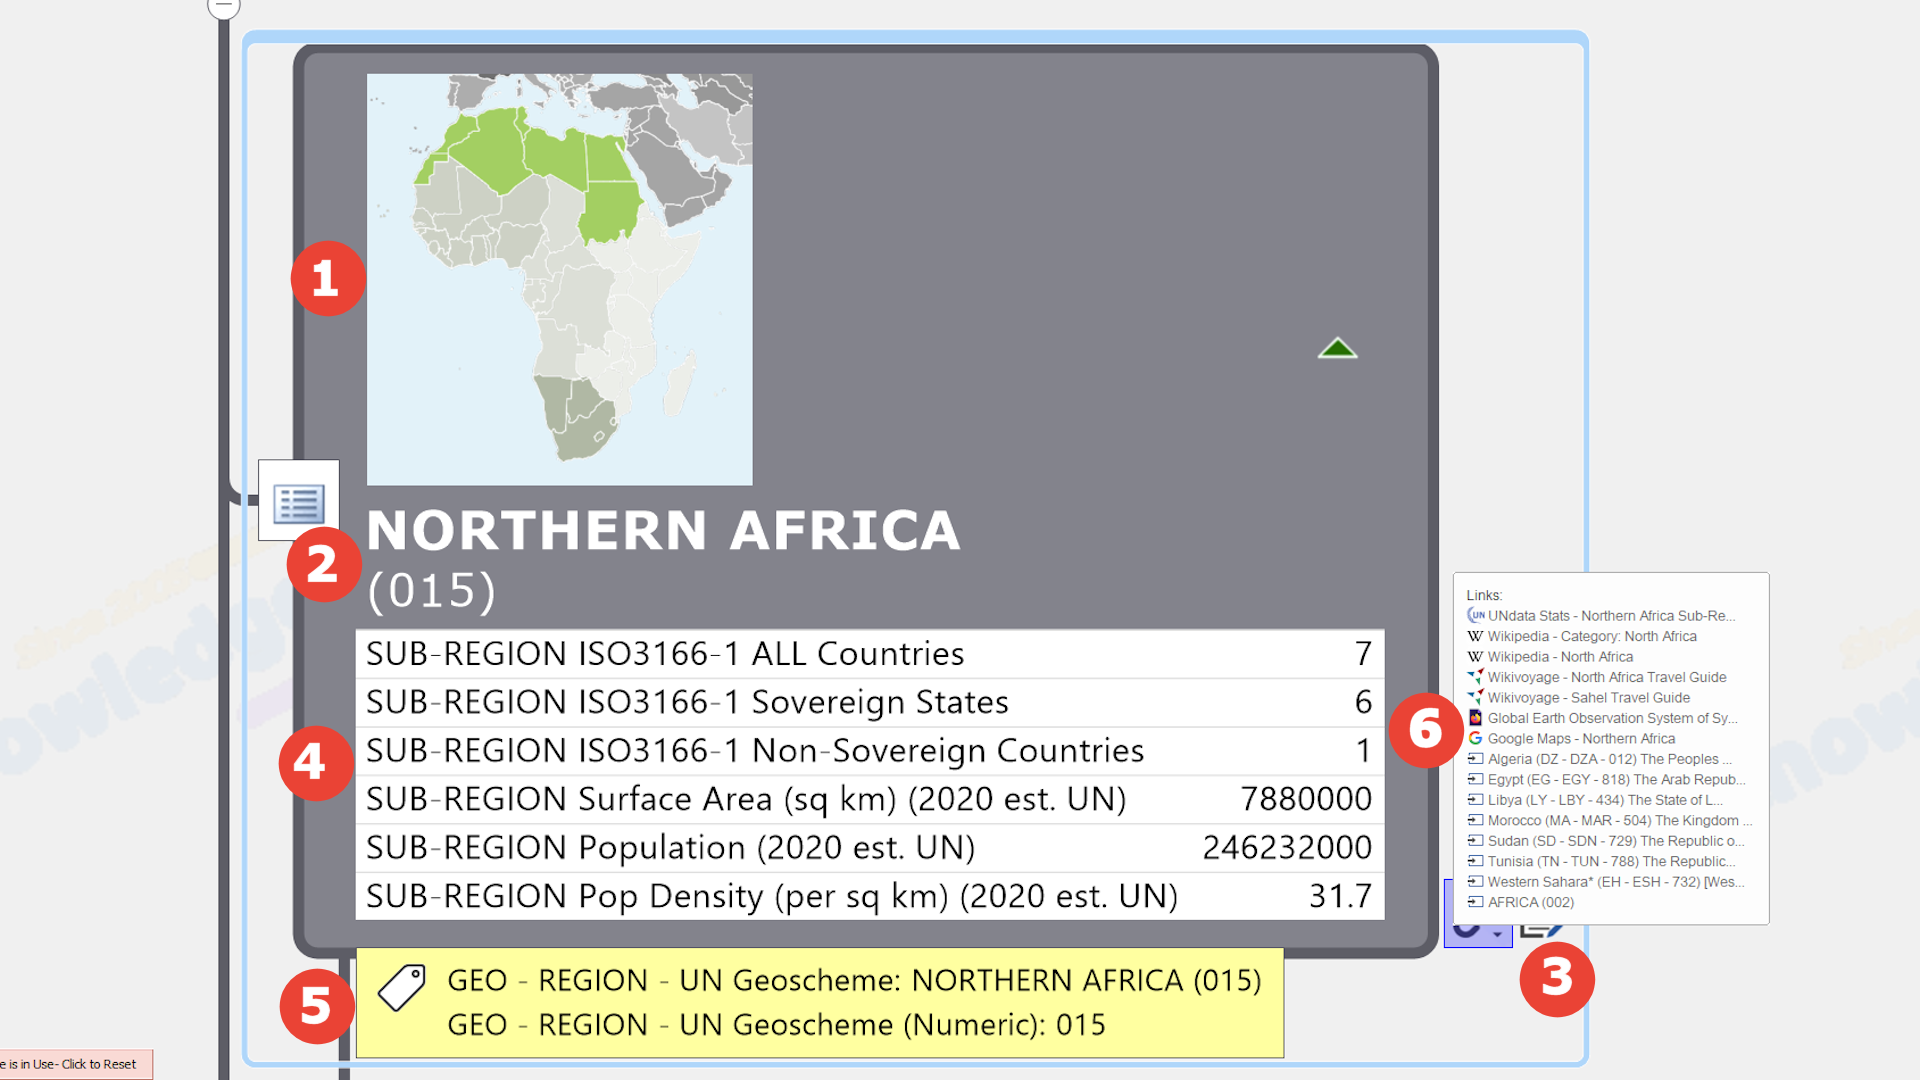
These are the main focus of the knowledge map, with each seed branch representing a particular building block in the real world e.g. geographic subdivisions, public bodies, elected representatives, communities etc. These are ‘visually rich’, with multiple embedded and attached knowledge elements, including core images like logos and geographic maps as well as links to online knowledge resources, and so are mini knowledge portals in their own right (see below).
.
Collection branches
These enable the grouping of related sub-branches, and can appear at more than one level in the map hierarchy.
.
Knowledge Resource Link branches
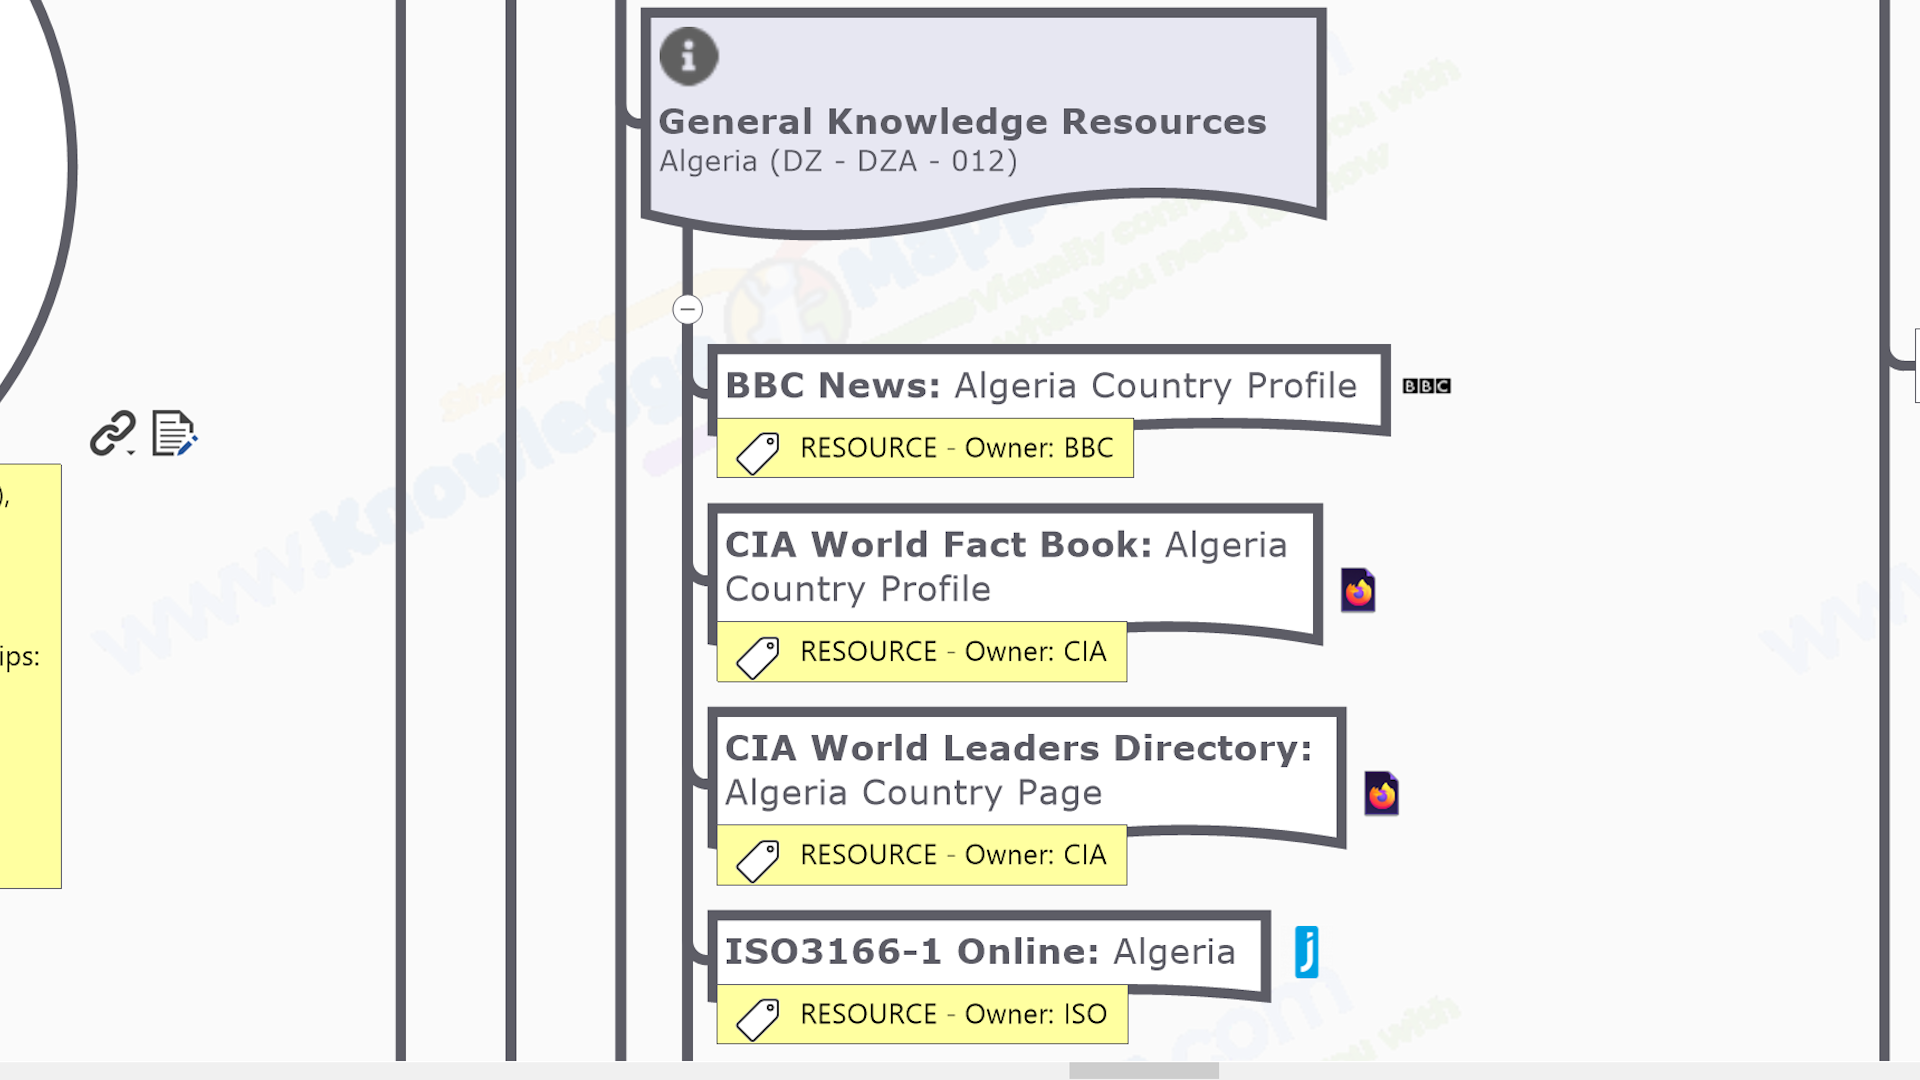
These sub-branches each have a single attached hyperlink to an external knowledge resource, with the branch title being that of the resource. They are grouped into related collections, such as ‘General Knowledge Resources’ or ‘Geographic Knowledge Resources’. Having a branch linking solely to one knowledge resource enables easier, more ‘thumb friendly’ browsing & discovery of them, which helps in more intensive activities like prolonged desktop research.
.
Map Meta branches
These are branches that tell the user more about the map and how to get the most out of it…
Each branch has a mix of elements embedded within, or attached to, it and/or has some other physical attribute that conveys core knowledge, or link to primary knowledge resources, about the ‘real world building block’ the branch represents. Created using functionality that is often unque to MindManger, these ‘knowledge elements’ take the form of…
.
Outline Shape
This may convey knowledge about some aspect of the subject of the branch. For example for branches representing geographic areas, the outline shape indicates the nature of its’ borders with neighbouring areas with respect to the sea…
CIRCLE = all coastal borders (ie. ‘island(s)’)
HEXAGON = all land borders (ie. ‘land-locked’)
ROUNDED RECTANGLE = mixed coastal & Land borders
.
Fill Colour
Sometimes the colour filling a branch conveys knowledge eg. a particular political party.
.
Image [Embedded]
Images such as logos, thumbnail location maps, flags, icons, people profile pictures etc. provide a unique visual element that users can instantly ‘latch onto’ as they navigate their way around the map.
.
Text
Thanks to MindManager’s unique ability to handle ‘rich’ text – the ability to variably format individual chatracters within a single text ‘string’ – we can pack several different pieces of ‘core knowledge’ – such as names & unique identifying codes (taken from official sources) – into the text of a single branch without it visually overwhelming the user.
.
Note [Attached]
A branch note can contain all the elements of a word processed page – variably formatted (‘rich’) text, links, tables and images, and so is an ideal place for supplementary information that would otherwise add visual clutter to the map.
.
Data Elements [Embedded]
MindManager has 2 unique ways to add contextual ‘facts & figures’ (i.e. text and number fields) to individual branches so that they are visible to the user (though only one can be used on any given branch)…
Spreadsheet Table / Chart –A branch specific spreadsheet table created using MindManager’s spreadshet tool (i.e. not referencing cells in a ‘normal’ spreadsheet file stored elsewhere), with all the usual functionality available. If the data content is structured appropriately, it can be toggled between ‘table’ and ‘chart’ view (though this view is ‘fixed’ when the map is exported to create the HTML version).
Multiple Single Data Fields – These are like single cells in a spreadsheet and the values – which can be text or numeric – can be used to format the branch using MindManager’s Smart Rules feature.
.
Index Marker Tags [Attached]
Arranged in groups and added to individual branches as appropriate, index marker tags add visible contextual knowledge, enable map filtering to show / hide only those branches with specified tags, and internal map navigation.
.
Multiple Hyperlinks [Attached]
Another unique feature, multiple links to a range of official definitive / plain old useful knowledge resources attached to the seed branch – usually selected from the full range of general & geographic knowledge resource collections – help turn the map into a knowledge portal without adding to the visual clutter.
We make our knowledge maps available to download in 2 file formats…
MindManager (.mmap) maps are the original maps we create. Thus when opened in the world’s best information mapping software, all the features of are available for full featured viewing, amending, expanding, adapting and using in other MindManager maps. These files can often be imported into other ‘mindmapping’ software applications, but with caveats (see the ‘Other mindmapping software’ tab below…).
HTML5 (.html) versions of our maps retain all the content – and most of the interactivity – of the original MindManager map (from which they are exported). They can be viewed by anybody, in any modern web browser software, on any digital device, without the need for any software plugins, as stand-alone files or embedded in web pages, on(or off)-line (once dowloaded).
Find out more below…
MindManager (.mmap) maps are the original maps we create. Thus when opened in MindManager, all the features of the world’s best information mapping software are available for…
MindManager is available for both Windows and Mac, with an Enterprise version that can be centrally installed on local area networks for users of 5 or more (eg. integrates with Microsoft SharePoint). There is also a free mobile app for Android.
A fully functioning 30 day free trial copy can be downloaded from the links. At the end of the trial period MindManager remains fully functioning, apart from the ability to save files. Thus it can be used as a free file reader for our knowledge maps in MindManager format.
HTML5 (.html) knowledge maps retain all the content – and most of the interactivity – of the original MindManager map (from which they are exported). For example they can be interactively queried by filtering using index marker tags to hide / show / highlight the coresponding branches.
And, just like any other html file, they can be …
However HTML maps cannot be edited or ammended, or content copied and used in other maps.
Because MindManager was the first software of it’s type and has been the market leader for over 20 years, many other information software programmes (or online platforms) that have subsequently emerged have the capability of importing map files in MindManager (.mmap) format. A word of caution however…
Our maps fully utilise the large range of unique ‘information cartography’ features available in MindManager…
These features are not supported by other information mapping software programs. Thus even if your program can import a MindManager file, how it copes with each of these features, and what it renders on-screen as a result, will vary from the MindManager version so user beware!
The fact that our knowledge maps can be published as HTML5 files – viewable in any modern web browser software, on any digital device, without the need for any software plugins, as stand-alone files or embedded in web pages, on(or off)-line – means they can be viewed & used by anybody!
However unlike MindManager users, almost by definition those who are using our HTML maps for the first time will be unfamiliar with the whole ‘knowledge map thing’ – what the different parts are, how you interact with it, how you acess the embedded / attached content (eg. accessing the multiple hyperlinks to knowledge resources, or filtering the map using marker tags).
That’s why we’ve produced the content (including short videos) below…
MindManager is the only information mapping software that can also publish it’s maps as HTML5 files…
HTML knowledge maps are…
Just about the same as the original – HTML versions of knowledge maps retain all the rich, visual content – and just about all the functional interactivity – of the original MindManager map, though how the user interacts with that functionality does differ a bit. It’s also continually being developed. For example HTML maps can now be visually filtered using the index marker tags attached to branches.
.
A bit bigger – The file size of the HTML version of the map is about 40 – 50% bigger than the original MindManager (.mmap) file, depending on the type of content (the presence of lots of images is really what bumps up the file size no matter which file format).
.
Easily Viewed – Just as importantly HTML map files can be viewed…
.
‘Thumb Friendly’ – Easily interacted with on small touch screen devices such as mobile phones.
.
Find out more about map elements, basic navigation and some tips for viewing on mobile devices in the following sections…
We pack a lot of knowledge ‘bits & pieces’ into our maps, either embedded within, or attached to, the 100’s of map branches (‘topics’) that provide the visual structure that connects them all together. This video explains the different types of knowledge content.
Now that you know the different elements that make up one of our knowledge maps, this video shows the basics of navigating your way around it and accessing the hyperlinks to the public domain knowledge resources via the hyperlinks…
As stated already our HTML knowledge maps are “thumb friendly and viewable in any modern browser, on any device”. Here are a few extra tips to enhance your user experience if viewing maps on a small touch-screen device…
Vertical Scrolling Of Webpage – If your ‘scrolling thumb’ is anywhere within the embedded map window when it slides across the touch-screen, you will pan around the map rather than scroll the webpage as a whole. To counter this there is always a narrow margin around the map panel at the edges of the screen, which you can ‘drag’ to move the page. (Viewing the map full screen in a new browser tab also gets round this issue :-).
.
Activating Branch Content – Clicking on map branches will activate content. Notes & the list of attached hyperlinks will open up in a side panel in the browser window. On mobile phones this panel can be take up a disconcertingly large proportion of the screen. If you don’t want to access this content, just click on the map background away from the activated branch, and the panel will disappear.
.
Following Hyperlinks – If there is a single hyperlink on a branch then clicking on the favicon symbol at the end once will activate it and the web resource linked to will open up in a new browser tab. If the branch has multiple hyperlinks attached (another unique MindManager feature) then these can only be followed by clicking on the link in the list in the side panel that opens up within the browser window when the branch is clicked. Note that notes and hyperlinks are on separate tabs within the sidepanel if both are present. Hyperlinks are listed in the ‘Attachments’ tab. **[NOT IN MM24**]
Our knowldge maps work on many levels…
By combining our unique range of data / information / knowledge hunting & cartographic expertise with MindManager’s many unique capabilities, we are able to…
Map the ‘building blocks’ of any sort of ‘knowledge space’ – By capturing the ‘things’ that make up any ‘space’ of human interest and endeavour – be it physical, virtual, conceptual or whatever – as branches in a MindManager ‘tree diagram’ map, we create a digital, visually structured, knowledge framework that not only records what entities make up ‘the space’, but also the hierachical relationships between them.
Map public domain knowledge resources (and their URLs) about the ‘building blocks’ of the space – By mapping the multiple official, definitive or just plain old useful knowledge resources about ‘the things’ that can be found in the public domain as sub-branches to ‘their branch’ in the map, they become both more easily discoverable within the ‘bigger picture’ context of the whole map, and more easily accessible as they are never more than a couple of mouse clicks away! No more scrolling through endless search results (assuming you know what to look for in the first place of course).
Incorporate core contextual knowledge about ‘the things’ from the resources in the map branches – Using MindManager’s many unique ‘information cartography’ features not only can multiple links to the core external knowledge resources be attached to the one branch, some of the core information contained in them can also be embedded within, or attached to, the map branches – such as images of ‘traditional’ geographic maps (eg. location maps) or basic geo-statistical data like area size and population – creating ‘knowledge seed branches’ that act as mini knowledge portals in their own right as well as reducing the need to consult the external resources for core information.
Share and use – Thanks to MindManager’s unique HTML export capability, we can make the maps files available to download in both HTML5 (.html) format – viewable on any any modern browser, on any device, without the need for any plugins, or indeed an internet connection to view it once it has been downloaded (so it can be viewed offline, in remote locations with no signal) – and the original MindManager (.mmap) format for full featured viewing, amending, expanding, adapting and re-purposing in whole or in part by MindManager users.
Find out more about the benefits they bring below…
Users of all our maps (HTML or MindManger) enjoy these benefits…
.
Visual Register – Maps are the official / definitive list of what’s what, visually structured in a way that makes it easier to see what’s there and understand the context.
.
Big Picture – See everything in the context of the bigger picture, within the context of the other (parent and/or sibbling) map branches and/or the official / definitive / plain old useful public domain knowledge resources linked to.
.
Contextual Knowledge – MindManager’s many unique information cartography features – rich (variably formatted) text, embedded images, embedded spreadsheets / charts / data fields, attached index marker tags – enable much useful knowledge to be visually encoded in the map so users don’t even have to look up the linked knowledge resources in many instances.
.
Fast Search – Even when a map has 100’s / 1000’s of branches & links, searching the content – in all the different ‘information channels’ that MindManager provides – is super quick.
.
Knowledge Portal – Maps contain 100’s / 1000’s of single / multiple hyperlinks attached to the map branches, which means a virtual library of official / definitive / plain old useful online knowledge resources about the ‘things’ in the register is no more than a mouse click away. The visual structure of the map makes it easier to discover, assimilate and utilise the new knowledge eg. for desktop research.
.
Interactively Query – Users can query the map using the filter function to hide / show branches based on the index marker tags attached to them (even the HTML ones).
.
Share – As they are single files, maps can be easily shared as email attachments, via file sharing services, or as downloads. HTML files have the added ability to be pusblished as standalone webpages, or embedded in existing web pages.
.
Print – Maps can be printed, in their entirety or in it’s filtered state. Printouts can be used as a visual prop to facilitate discussions and meetings amongst stakeholders, no matter how impromptu.
.
Archive – Because the maps are an actual digital file (as opposed to a web page assembled ‘on the fly’ from a database), they can be permanently preserved as a knowledge artefact by simply saving it in a digital archive. Obviously as time goes on the knowledge in the map will gradually be superceded and the URL’s for the linked resources therein may no longer work, however the knowledge that this was the big picture at one time and that these knowledge resources about it existed (and may still exist but now at a new URL?) will still be useful in the future.
Discovering knowledge is usually just the starting point. Once it has been understood & assimilated, users want to do things with it, depending on why they were looking for it in the first place. MindManager users therefore have further options available to them to take our knowledge maps to the next level for their own benefit…
.
Living Document – As well as re-arranging the existing content to suit them, users are free to add their own, as and when they want, turning the map into their own living document. So for example users can add their own appointments & events (with links to files etc.) to our calendar maps, turning them into their personal diaries, after having first perhaps removed some of the content (eg. international events), or added another level of granularity using content from the time template map, to personalise it. Or if undertaking desktop research using our world atlas knowledge maps, they can selectively add the newly disocovered knowledge to the map as sub-branches and/or branch notes on the existing seed branch, which has the added beenfit of retaining the ‘big picture context’ of where it came from in the first place.
.
Template Basemap – If your need to add / ammend your map with the latest knowledge is ongoing, then you can think of it in terms of a ‘basemap’, to which you are adding additional ‘layers’ of knowledge (just like ‘layers’ of geographic ‘things’ – points, lines, polygons, travel routes – on top of a geographic basemap from Ordnance Survey or Google). Once you have a basemap template, it is easy to re-purpose for many other uses without having to start from scratch each time.
.
Content Source – Use any of the content of the map in other maps as appropriate. So not just whole branches withtheir sub-branches, but individuala embedded / attached elements like spreadsheets / charts, data fields, hyperlinks etc. This could be a simple, one off ‘copy & paste’, or creating a map part that is saved to your parts library so that it it is instantly accessible to be added to any map without recourse to the original source map.
.
Index Marker Tag Source – This is especially true of groups of index marker tags, used to tag map branches. Thanks to the great MAP add-in from our partners at Olympic, a whole new group of marker tags can be created from a whole level of map sub-branches with a single mouse click. As our maps are usually definitive registers of ‘real world things’, our maps always contain those as a groupf of marker tags as well as branches. For example our world atlas knowledge maps contain tags for every country in the world (as officially defined by ISO3166-1), which can be used to ‘geo-filter’ the map ie. show only those branches tagged with a particular ‘geographic location.
The origins of knowledge mapping, MindManager software and our own journey to creating the knowledge maps that we do, lies in the technique of ‘mind mapping‘, popularised in the 1970’s by by British popular psychology author and television personality Tony Buzan (though the use of diagrams that visually “map” information using branching and radial tree maps traces back centuries).
Find out more below…
The technique of ‘Mindmapping‘ was originally pioneered by Tony Buzan in the 1970’s & 80’s (though the use of diagrams that visually ‘map’ information using branching and radial tree maps traces back centuries). It is a manual, graphical (ie. using coloured pens and paper) way of capturing, storing and working with your own knowledge and thoughts that works in harmony with the way your brain actually processes and stores it – that is in ‘branching’ chains of associated concepts (literally ‘chains of thought’).
The Power of a Mind to Map: Tony Buzan at TEDxSquareMile (Dec 18, 2012) [19:35]
How to Mind to Map with Tony Buzan [4:59]
In the creation of a ‘mind map’ knowledge is not captured ‘linearly’ in traditional lines, paragraphs and pages of text, but instead in discrete words and associated images, arranged around the central idea, connected together by radiating branch lines that show the hierarchical inter-relationships between them.
This forms a branching structure, radiating out from the centre, which is why they are also known as ‘tree diagrams‘. Text is minimal, a few words only that encapsulate the concept or idea, but this is supplemented by the use of different colours, pictures, shapes and symbols so that the mindmap engages the whole brain, both in creating it and reading it.
The power of the mindmapping process is that, because your brain can literally see your thoughts and the relationships between them in front it as a picture, it can’t help but think of other thoughts and connections, which once added to the map, spark yet more thoughts and so on in a positive feedback loop.
Thus a mind map is both a fundamental ingredient in the mental thought process, as well as a physical, tangible by-product of it.
Given the popularity of the mindmapping technique (especially in the worlds of Education and Business), but the physical limitations placed on it through using a sheet of paper and pens, by the 1990’s it was only a matter of time before somebody wrote a software program to create mindmaps on a desktop personal computer (well there weren’t any other kinds of personal computer back then, right kids? ;-).
MindManager was one of the first (version 1 was released in 1994 under the name ‘MindMan’), but this was followed by a handful more by the 2000’s (including Tony’s own iMindMap, which was used to create the above map), and now there are dozens and dozens and it’s a very crowded ‘software space’ (though all are not created equal, as we will see in the next section).
MindMapping software overcomes some of the physical limitations of the traditional, analog process, but also adds fundamental abilities that were not conceived of in the original scope and design of mind mapping, which came from a pre-personal computing age…
And so, just like any other digital file, a digital mindmap can be stored and shared and archived and retrieved and re-worked on and everything else…
Digital maps can be endlessly amended, edited and rearranged within the software ‘on the hoof’ as they are being created. This is at best problematic on paper, if not completely impossible once the main structure of the map has been committed to. In other words digital maps can be changed “at the speed of thought”.
Unlike a sheet of paper, the canvas in mindmap software has no edge. Thus it is possible to literally follow and record a complete ‘chain of thought’ without the mental disruption of worrying about running out of space.
Likewise there is no limit to the number of levels of sub-branches that can be added to the map. Furthermore at any level in the hierarchy, the software allows you to collapse the sub-branches below so you can’t see them, and then expand them out again so you can. Thus it is possible to record effectively unlimited amounts of information down to the finest level of detail, but to hide the detail from view until required so that just the upper branches – which outline the ‘big picture’ about the central topic in question – can still be seen in one view.
There are additional ways that information can be embedded within, or attached to, the branches of a digital mindmap, over and above the ‘traditional’, immediately visible text and images, such as…
Notes attached to the branch (which can be at least an infinite amount of text and sometimes tables and images).
Hyperlinks ‘attached’ to a branch can take the viewer anywhere on the internet, or a file on the computer, when ‘clicked’.
Index Markers ‘attached’ to a branch can ‘tag’ it with contextual knowledge.
In todays ‘information-age society’ almost everything we do in terms of work is digital – creating, consuming and sharing a lot of information on a daily basis in order to do whatever is we want to do. Mindmapping software is an ideal digital tool to do all that in the one environment. From defining the problem / project, through brainstorming a solution (how the problem will be solved / deciding on the project content), to a plan of action to deliver it (who is doing what, by when, with the resources available), to a dashboard that is visually telling you if everything is going according to plan!
The key thing to note – and this is one of the ‘killer applications’ of mindmapping software that saves you time and makes business processes so much more efficient – is that the final map produced by the end of each stage, is re-purposed as the starting point of the next one.
As you can see ‘mindmapping’ software goes way beyond the manual, paper-based technique of ‘mindmapping’ as envisaged by Tony Buzan. It is a hugely versatile digital tool that enables users to do a lot of the everyday digital stuff they have to do anyway, but much quicker, easier and efficiently, allowing them to stay more in control of the whole information capturing, understanding and sharing process.
Anyway as ‘mindmapping software’ became popular, there was heated debate amongst mindmapping advocates as to whether or not mindmaps created by compter software were ‘real mindmaps’ according to the rules of Tony Buzan. However we have never been much vexed by this academic argument because, as cartographers, we could see the exciting possibilities that mindmapping software offered for the mapping of any sort of ‘knowledge space’. Not just abstract thoughts and ideas generated inside your brain, but also tangible things that exist in the real world (often in hierarchical relationships), and the knowledge resources about them that exist in the online public domain.
MindManager software has always been about more than just mindmapping on computer. It has always had a business focus (often describing itself as “the missing piece of Microsoft Office), lending itself to everyday tasks that individuals and teams in organisations need to do – brainstorming, project planning, task lists etc.
When we first started using MindManager over 20 years ago it was for those classic business mapping uses, and it soon became our ‘go to digital tool of first resort’ for working with any sort of information. However we were always struck by the similarities in the processes of mapping ‘business information’, and the traditional ‘geographic information’ mapping we had hitherto been involved with.
And so began our development of MindManager as an information cartography tool, capable of ‘visually capturing’ pretty much any ‘space’ of human interest and endeavour (be it physical, virtual, conceptual or whatever) in a single ‘map’ (ie. a visually structured document), or series of inter-linked maps. Not just the ‘things’ that occupy the space, and the spatial inter-relashionships between them, but also the man knowledge resources about each ‘thing’ that already existed about them in the public domain, and the links to those resources.
Even though many other ‘mind mapping’ tools have emerged into what is now a very crowded space over the years, both ‘standalone’ software or an ‘online service’, MindManger remains our main knowledge mapping tool. There are a couple of reasons for this. Firstly it has always grown as the wider technology has (eg. the integration with first Microsoft SharePoint and now Teams). Secondly – and this is the most important one – no other software has such a wide variety of ‘visual channels’ to attach / embed information in a map. Most of these features are unique to MindManager and it is these that we use to take our ‘information cartography’ to the next level. You can find out more about these in our MindManger section, but here are the main ones…
Not only does MindManager offer an unrivalled number of different map layouts – ‘traditional’ (radiating from the centre) mindmap, organisation chart, timeline etc. – the layout of individual branches & sub-branches can be separately styled, no matter where they are in the hierarchy.
MindManager maps can have 1000’s of branches without affecting the software ‘performance’. The biggest one we have created so far had 20,000+ branches. This has been enough for us to knowledge map the solar system, and all the countries of the world in a single map. Thus we can be fairly confident that we can map all the ‘things’ in a space before we start!
By being able to variably format individual elements within the text of a single branch, we can create visual hierarchies for the different components. This means the text string can contain a greater amount of more diverse information, without visually overwhelming the viewer eg. including unique identifying codes (taken from official sources) as well as the name.
MindManager has the unique ability to attach multiple hyperlinks to a single map branch. This means that…
1) maps need fewer branches so are less visually cluttered;
2) a single branch can become a mini knowledge portal in it’s own right;
3) links to core knowledge resources can remain with the branch when it’s re-used in other maps (whether or not it’s the key focus of that map).
4) a map with 1000’s of branches, can contain many more 1000’s of hyperlinks!
Multiple data fields (akin to single cells in a spreadsheet) can be embedded within a branch and is another way of adding contextual facts & figures to the map. Also the field values can be used to visually format the individual branch eg. if the value is greater than a particular number then make the branch text / fill this colour, or this shape (this is equivelant to ‘thematic mapping’ in GIS)…
MindManager has the unique ability to export maps as HTML5 (.html) files. These retain all the content – and most of the interactivity – of the original eg. they can be interactively queried by filtering using index marker tags to hide / show / highlight the coresponding branches. And, just like any other html file, they can be…
1) viewed by anybody, in any modern internet browser (Chrome, Firefox, Safara etc.), on or offline (once downloaded), on any device;
2) shared by email or file sharing services (eg. DropBox);
3) published online as stand-alone web pages, such that they have their own URL (which can be shared), or even embedded within existing pages (and hosted somewhere else eg. the aforementioned URL).
This means that anybody can view the knowledge maps we create, they don’t need to have MindManager software (unless they want to amend or re-use the content).
Anyway as you can see MindManager software really does enable us to take knowledge mapping to the next level….
We seriously began using MindManager – the world’s best information mapping software – as a business information mapping tool back in 2002 (see above). However we soon realised that the MindManager maps we were now creating, and the geographic maps that we created and worked with every day (Knowledge Mappers started out as a consultancy offering geographic information mapping & spatial analysis services), had many characteristics in common….
Maps are a type of visual knowledge format in their own right. By ‘visual knowledge’ we mean that they capture and encode data / information / knowledge within them as visual elements (‘pictures’ at their simplest) that convey said to the viewer visually rather than as text that they have to first understand the words of, and then interpret their meaning.
Sure you could use words to start describing a map, but you would soon tie yourself up in knots – where do you even start? Do you describe every ‘thing’, or just the most important ‘things’? Do you describe the relationships between ‘the thing’ and every ‘other thing’, or just the ‘adjacent things’ round about it? And is that description absolute in terms of distance, or relative in terms of position? And isn’t it just easier to draw a picture?
At it’s simplest ‘a map’ is a visually structured index of what ‘things’ together define a particular ‘space’, and the inter-relationships between them within ‘the space’.
Geographic maps depict ‘geographic (ie. ‘real world’) space’ and the ‘geographic things’ that exist within it…
In a MindManager map the space is always ‘conceptual’ (ie. it exists in our ‘brain space’), and the branches are the ‘things’ that define the ‘conceptual space’. Traditionally the ‘conceptual things’ in mindmaps are of an individual’s ‘thoughts’ and ‘ideas’ about a particular subject, however we realised that they was no reason why they couldn’t also be about ‘real world things’ – say the aforementioned ‘human geaographic things’.
LIGHTBULB MOMENT
Professionally produced geographic maps are a visual record of the recorded locations of ‘the geographic things’ within the mapped ‘geographic space’. Geographic locations can be defined in 2 ways, each of which in turn enable the spatial inter-relationships between ‘the things’ to be described in different ways…
Where the relatively defined relationships between ‘the things’ within ‘a space’ are logical and hierarchical, they can also be captured in a MindManager map.
The classic logical tree diagram map for a ‘conceptual human space’ is an organisation chart, which shows the different divisions and sub-divisions of an organisation, and who is in charge of who. However it is surprising how often that the ‘things’ that make up our everyday ‘human geography space’ have hierachical inter-relationships. For example the ‘Countries of the World’ are arranged into macro geographic sub-regions and regions for official statistical purposes by the United Nations, whilst also being made up of sub-national divisions like states, counties and communities. It is through all these administrative areas that the afairs of the human race are usually organised and run…
ANOTHER LIGHTBULB MOMENT
A map encodes & conveys information visually, but crucially does so in a logical, structured way using the art & science of cartography, which uses cartographic principles & devices such as….
All these are in conjunction with a minimal amount of text – which is usually in the form of brief labels of said points, lines and areas – which too are visually formatted using the same cartographic devices.
Together all these elements create a visually structured, cartographic framework (‘language’) of knowledge elements that…
Most of us at some point have taken a geographic map and drawn our own information on top of it to quickly transfer our geographic knowledge to others or for it to be transfered to us – eg. ‘the route’ for new friends to get to our house, or for us to get from the hotel we’ve never stayed in before to the museum we’ve never visited before. In the old days it was by drawing a line on a paper map, but Google Maps showing you the ‘routes’ between the 2 points as coloured lines on your mobile phone screen is still the same priniple.
And that principle is that the starting geographic map is acting as a ‘basemap’ knowledge layer upon which additional layers of more specialised knowledge (eg. ‘the route’) are added. These additional layers are proper ‘layers in the information system’ in their own right, but without the visual context provided by the underlying basemap layers (which place them in a bigger picture / real world space, that is familiar to the viewer) they would be difficult for a viewer to understand, especially without any exisiting ‘local knowledge’. For example ‘a route’ is just a line on a piece of paper (or screen) if it doesn’t reference ‘things’ in ‘geographic space’ – a starting location, a destination location and named roads in between.
Similarly we can think of each level in the branch hierarchy of a MindManager map as additional layers of ‘related things’, each building on the previous layer. This is the basis of our series of Countries of the World knowledge atlas maps (see below).
ANOTHER LIGHTBULB MOMENT
Geographic maps have 2 lives…
In the age of paper geographic maps this cycle of ‘survey, publish and archive’ was usually infrequent, due to the expense of manual field survey methodoligies, but also the fact that the pace of change of the real world was not that fast. Superceded maps were physically archived in map libraries (just like the books in the rest of the library) so they could be still be available to future generations to consult.
However in the digital age the whole process happens much quicker. Field surveyors use digital tools and upload their data to a central spatial database there and then, where it may be augmented with data gathered using remote sensing techniques (from satellites, planes and drones). Online mapping services like Google Maps ‘assemble on demand’ the maps they display to the viewer from the objects in the spatial database, so they always ‘serve up’ the most current picture. Thus unless the underlying digital data is shared, a ‘Google Map’ isn’t a ‘map type artefact’ that can be archived.
By definition MindManger maps too are digital, however they are saved as a physical software file, which can be copied, stored locally and/or centraly, and archived.
In other words in theory we could replicate ‘traditional maps of geographic space’ in a MindManager map – well at least it coud be a visually structured record of the ‘geographic things’ that define a single ‘geographic space’ along with the hierarchical relationships between them.
So we realised that it may be possible to use MindManager to map ‘geographic space’. Yes it would be in a more limited way compared to some aspects of a ‘traditional geographic map’, however we could use mindmapping principles and MindManager’s amazing ‘information cartography’ tools to take other aspects much, much further. For example…
That in fact we could create a knowledge atlas (ie. a knowledge map about real world geographic things)…
But how did we actually do it? How do we get from a ‘traditional geographic map of countries of the world’, to a ‘knowledge atlas of countries of the world’?
Well it’s all about those inter-relationships between the geographic building blocks (ie. the countries) that make up a space (ie. the world), as it is mapping these in MindManager that will create the fundamental, inter-connected framework of map branches.
But in order to do that, we need to know….
As we’ll see below, the answers to these are officially defined in downloadable data tables & spreadsheets, which can be easily imported into MindManager as a starting point….
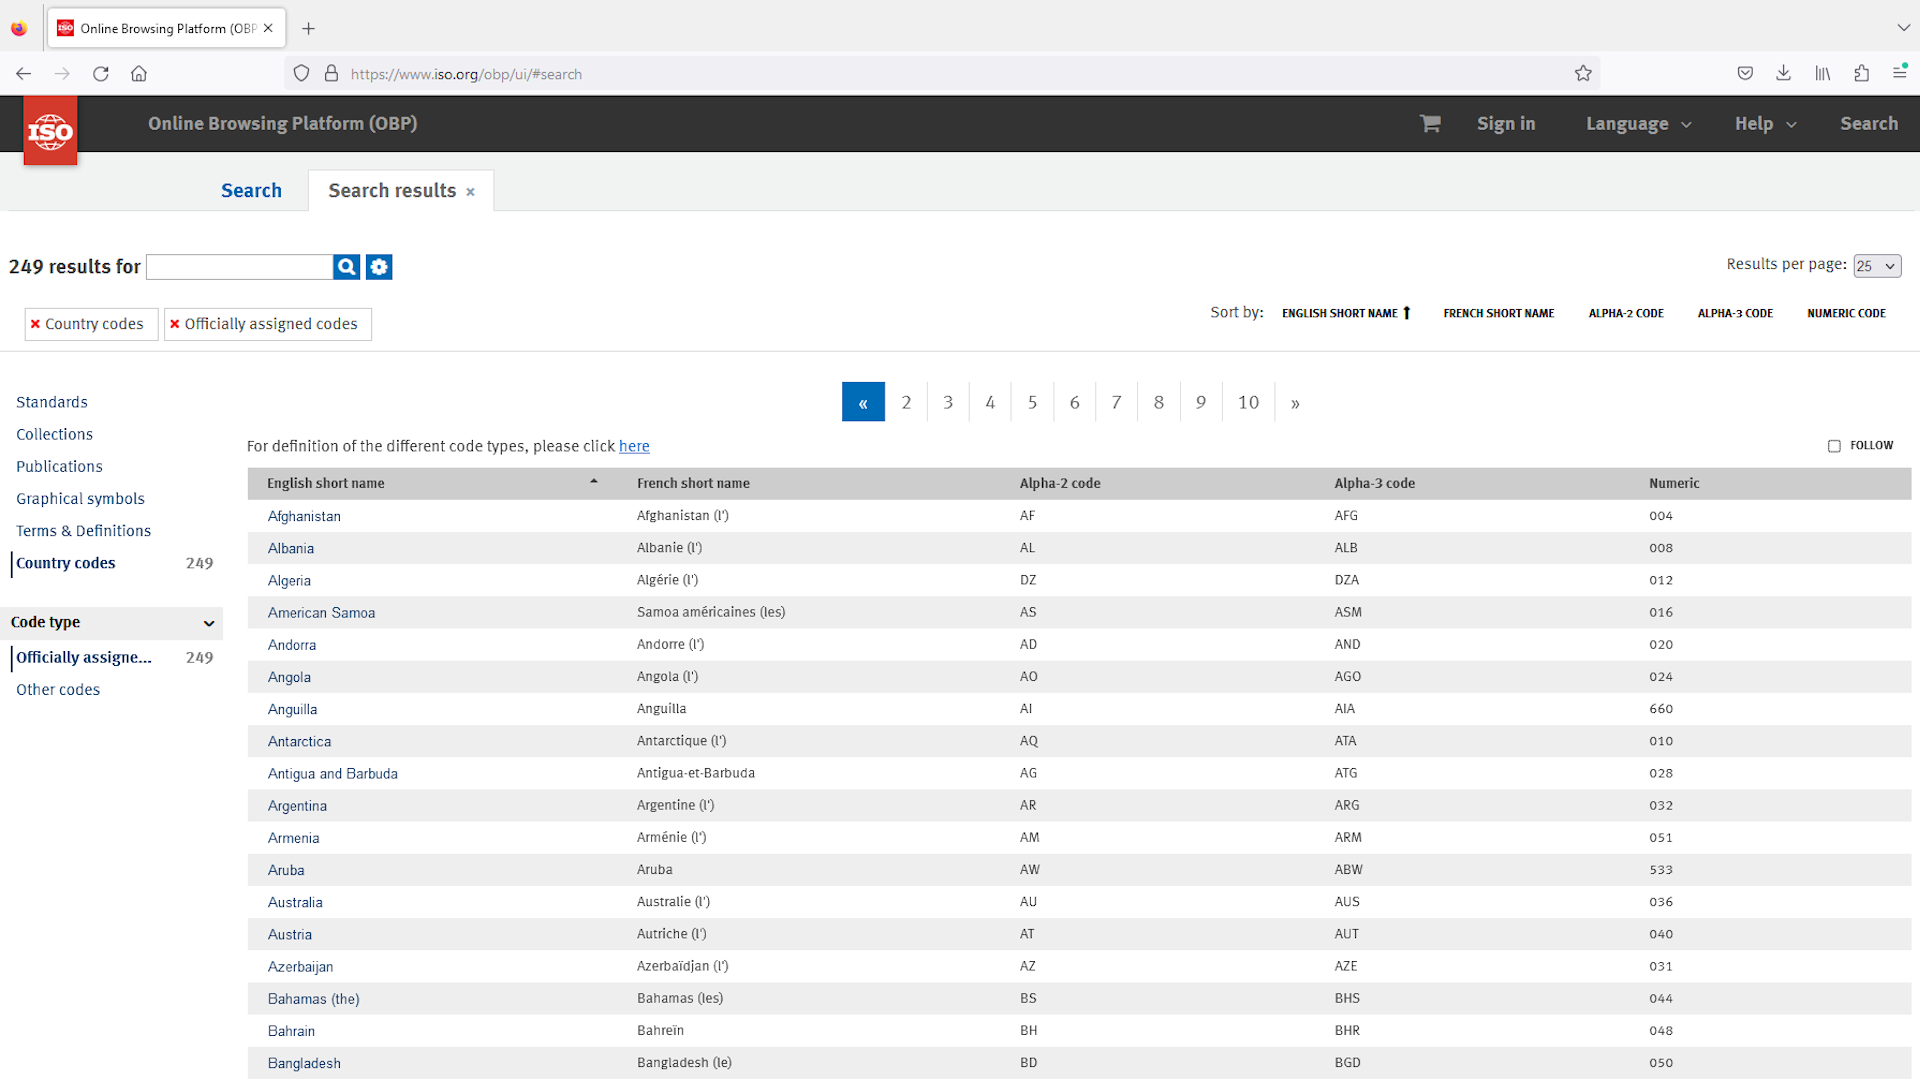
So it turns out the official list (or ‘register’) of the ‘Countries of the World’ is the international standard ISO3166 – ‘Codes for the representation of names of countries and their subdivisions’. This can be found on the International Standards Organisation (ISO)’s website, with the actual data table on the ISO online browing platform. (Though as ISO point out they are only responsible for maintaining the coding system of unique letters and/or numbers – so that countries and their subdivisions can be referred to in a completely unambiguous way that transcends language barriers – whilst the names come from official United Nations sources.)
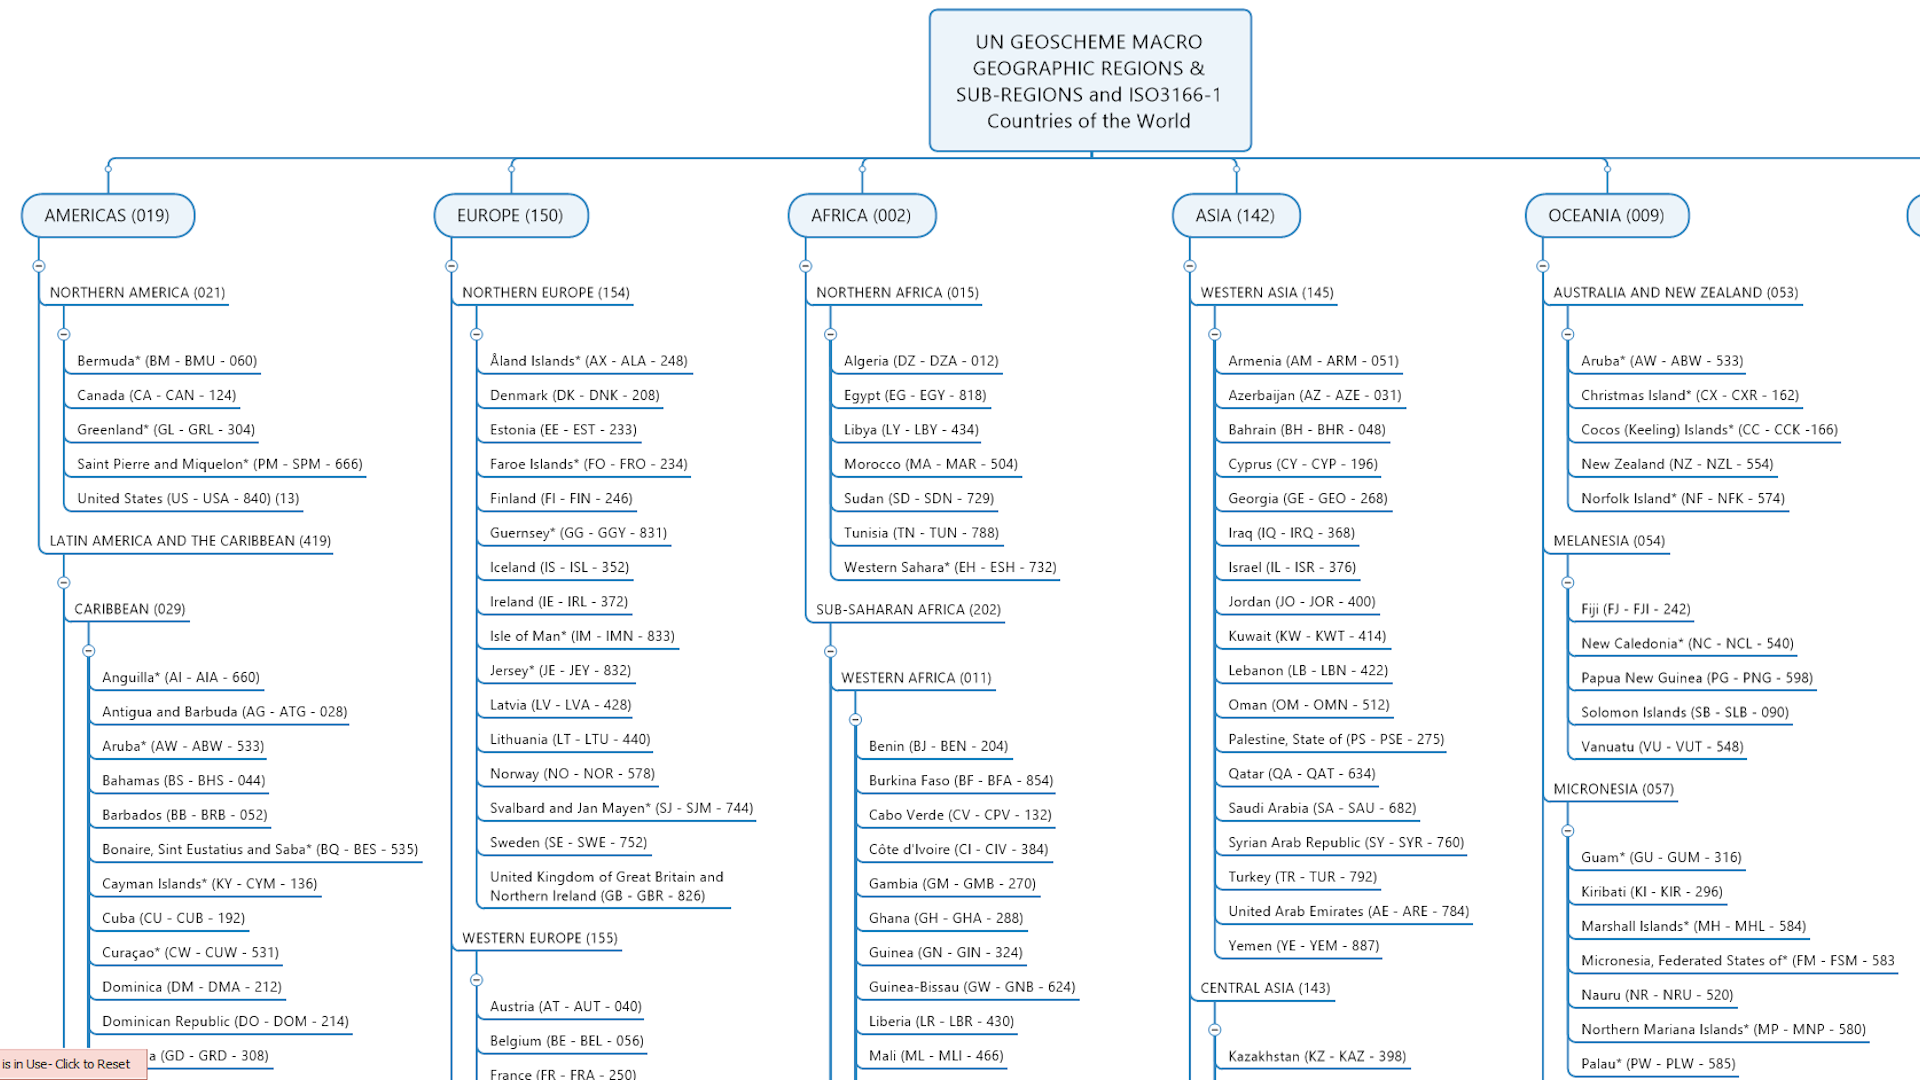
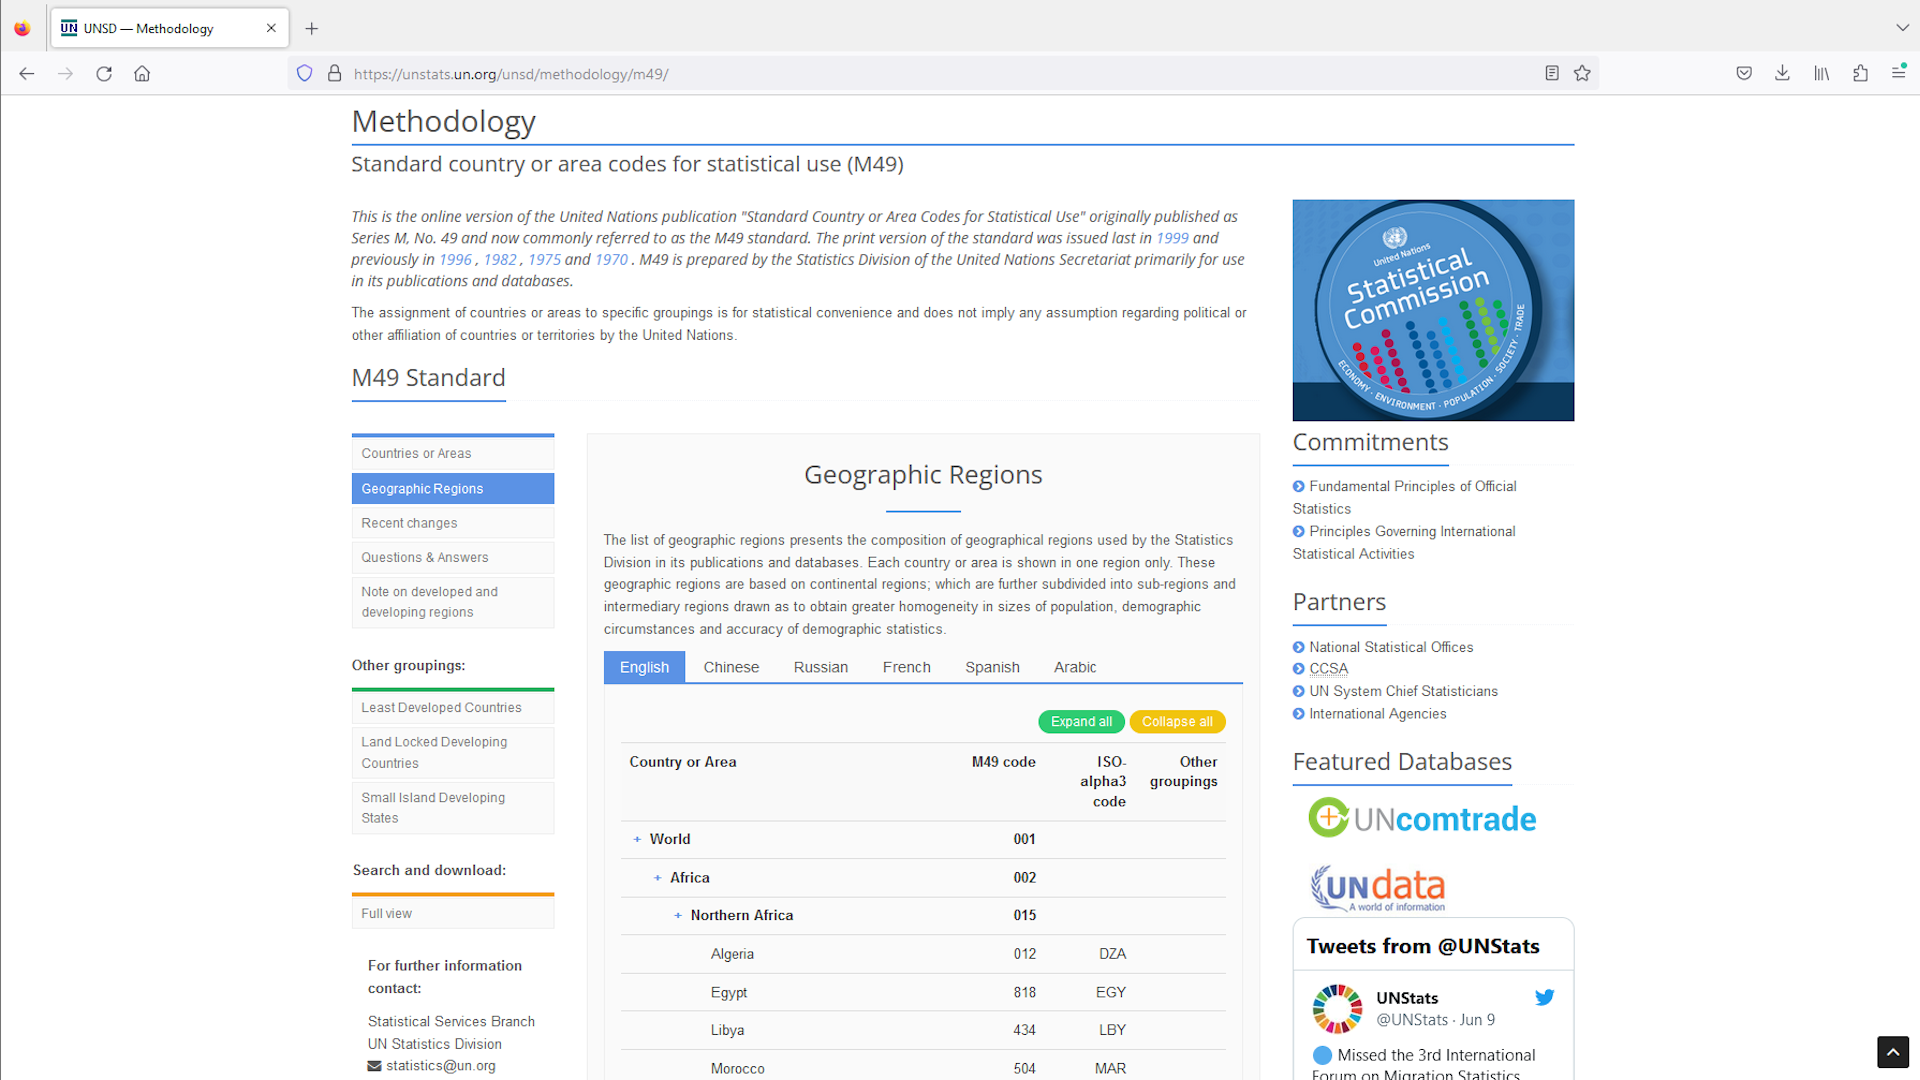
There are many ways of arranging the ‘Countiries of the World’ into related groups and sub-groups, but the main official (but not only) schema for grouping them together geographically into macro-geographic regions and sub-regions is the United Nations Geoscheme (or M49 Statistical Standard), devised by the UN to consistently collect and aggregate country based statistics to try and keep track of what’s going on in this big old crazy world of ours.
Thus it is the UN Geoscheme that officially defines the hierarchical inter-relationships between the official ‘Countries of the World’, and it’s those that our MindManager map will capture as a network of knowledge seed branches – one for each country, region and sub-region – inter-connected by relationship lines to create the hierarchy and so define ‘the space’.
And so now we’ve tracked down this definitive data source, we can get cracking….
Turning an existing data table into a map is where MindManager comes into it’s own, providing several ways of ‘getting it into the system’…
The choice is yours, but personally speaking, as with mindmapping, there’s nothing like the physical process of creating a knowledge map with your own hands to really improve your understanding of the subject, especially from a base knowledge of zero.
Anyway once that’s done, we now have our basic MindManager map – a ‘tree diagram’ network of branches (one for each country, region and sub-region), inter-connected by relationship lines to visually define the hierarchy.
So now that we have our basic MindManager map – a ‘tree diagram’ network of branches (one for each country, region and sub-region), inter-connected by relationship lines to visually define the hierarchy – how do we transform it into our Countries of the World Knowledge Atlas?
So what does this basic MindManager map lack that we will have to add to create our Knowledge Atlas map? Well….
In other words what is required is a lot of detective work and application of cartographic ‘know how’….
In order to include links to official / definitive / plain old useful public domain knowledge resources about the ‘Countries of the World’ in our map, we first need to track them down ourselves wherever they are in the online public domain (what we call ‘going on a knowledge safari’ :-).
This may seem like a daunting task, but actually we’ve already ‘got one in the bag’ in the form of the original ISO online platform listing all the countries that are part of the ISO3166-1 standard, as each one has it’s own listing page (eg. this one for the United Kingdom of Great Britain and Northern Ireland).
And as we’ve said, the GeoScheme schema was devised by the United Nations for country-level data gathering, so it’s no surpirse that each country and region has a data page on the UNdata portal – so that’s 2 knowledge resource links. (Actually it’s quite a lot more as once you look deeper you will find they also have pages on the websites of many of the UN family of organisations, but that’s for later :-).
And then of course there’s Wikipedia, because in this day and age just about everything important has it’s own page (or even it’s own category) on Wikipedia (the corollary being if it’s not on Wikipedia, is it even important? – discuss ;-)….
And then there’s all the external links referenced to in the Wikipedia page….
And possibly sister sites to Wikipedia, like the Wikivoyage site for travellers….
And then there’s all the ones we can find with a browser and a Google search bar (other search engines are available ;-)….
Of course before they’re added to the final map all these links have to be….
However once that is done…
Thus as well as being a visually structured index of knowledge resources about the ‘things’ in the ‘space’, our knowledge map is now also a portal to those resources.
Using MindManager’s many unique ‘information cartography’ features (see above), some of the core information contained in the linked to resources could be embedded within, or attached to, the indiividual seed branches in the map as one or more knowledge elements….
.
Outline Shape – This may convey knowledge about some aspect of the subject of the branch. For example for branches representing geographic areas, the outline shape indicates the nature of its’ borders with neighbouring areas with respect to the sea…
CIRCLE = all coastal borders (ie. ‘island(s)’)
HEXAGON = all land borders (ie. ‘land-locked’)
ROUNDED RECTANGLE = mixed coastal & Land borders
.
Fill Colour – Sometimes the colour filling a branch conveys knowledge eg. a particular political party.
.
Image [Embedded] – Images provide a unique visual element that users can instantly ‘latch onto’ as they navigate their way around the map. So such things as….
.
Text – Thanks to MindManager’s unique ability to handle ‘rich’ text – the ability to variably format individual chatracters within a single text ‘string’ – we can pack several different pieces of ‘core knowledge’ – such as names & unique identifying codes (taken from official sources) – into the text of a single branch without it visually overwhelming the user.
.
Note [Attached] – A branch note can contain all the elements of a word processed page – variably formatted (‘rich’) text, links, tables and images, and so is an ideal place for supplementary information that would otherwise add visual clutter to the map.
.
Data Elements [Embedded] – MindManager has 2 unique ways to add contextual ‘facts & figures’ (i.e. text and number fields) to individual branches so that they are visible to the user (though only one can be used on any given branch at one time)…
Spreadsheet Table / Chart – A branch specific spreadsheet table created using MindManager’s spreadshet tool (i.e. not referencing cells in a ‘normal’ spreadsheet file stored elsewhere), with all the usual functionality available. If the data content is structured appropriately, it can be toggled between ‘table’ and ‘chart’ view (though this view is ‘fixed’ when the map is exported to create the HTML version).
Multiple Single Data Fields – These are like single cells in a spreadsheet and the values – which can be text or numeric – can be used to visually format the branch using MindManager’s Smart Rules feature.
.
Index Marker Tags [Attached] – Arranged in groups and added to individual branches as appropriate, index marker tags add visible contextual knowledge, enable map filtering to show / hide only those branches with specified tags, and enable internal map navigation.
.
Multiple Hyperlinks [Attached] – Another unique feature, multiple links to a range of official / definitive / plain old useful knowledge resources attached to the seed branch – usually selected from the full range of general & geographic knowledge resource collections – help turn the map into a knowledge portal without adding to the visual clutter.
In practice these processes are not sequential but organically iterative – one feeds into the other, which then feeds back into that and so it goes on (like the Mindmapping process described earlier, but unlike that it is constrained by what is actually out there in the real world).
Anyway we hope you agree that the sum of the whole is greater than the sum of the individual parts 🙂
You can find out more about the details of knowledge mapping individual countries in more detail in the ‘About – The Process’ section of ths Scotland The Map website.
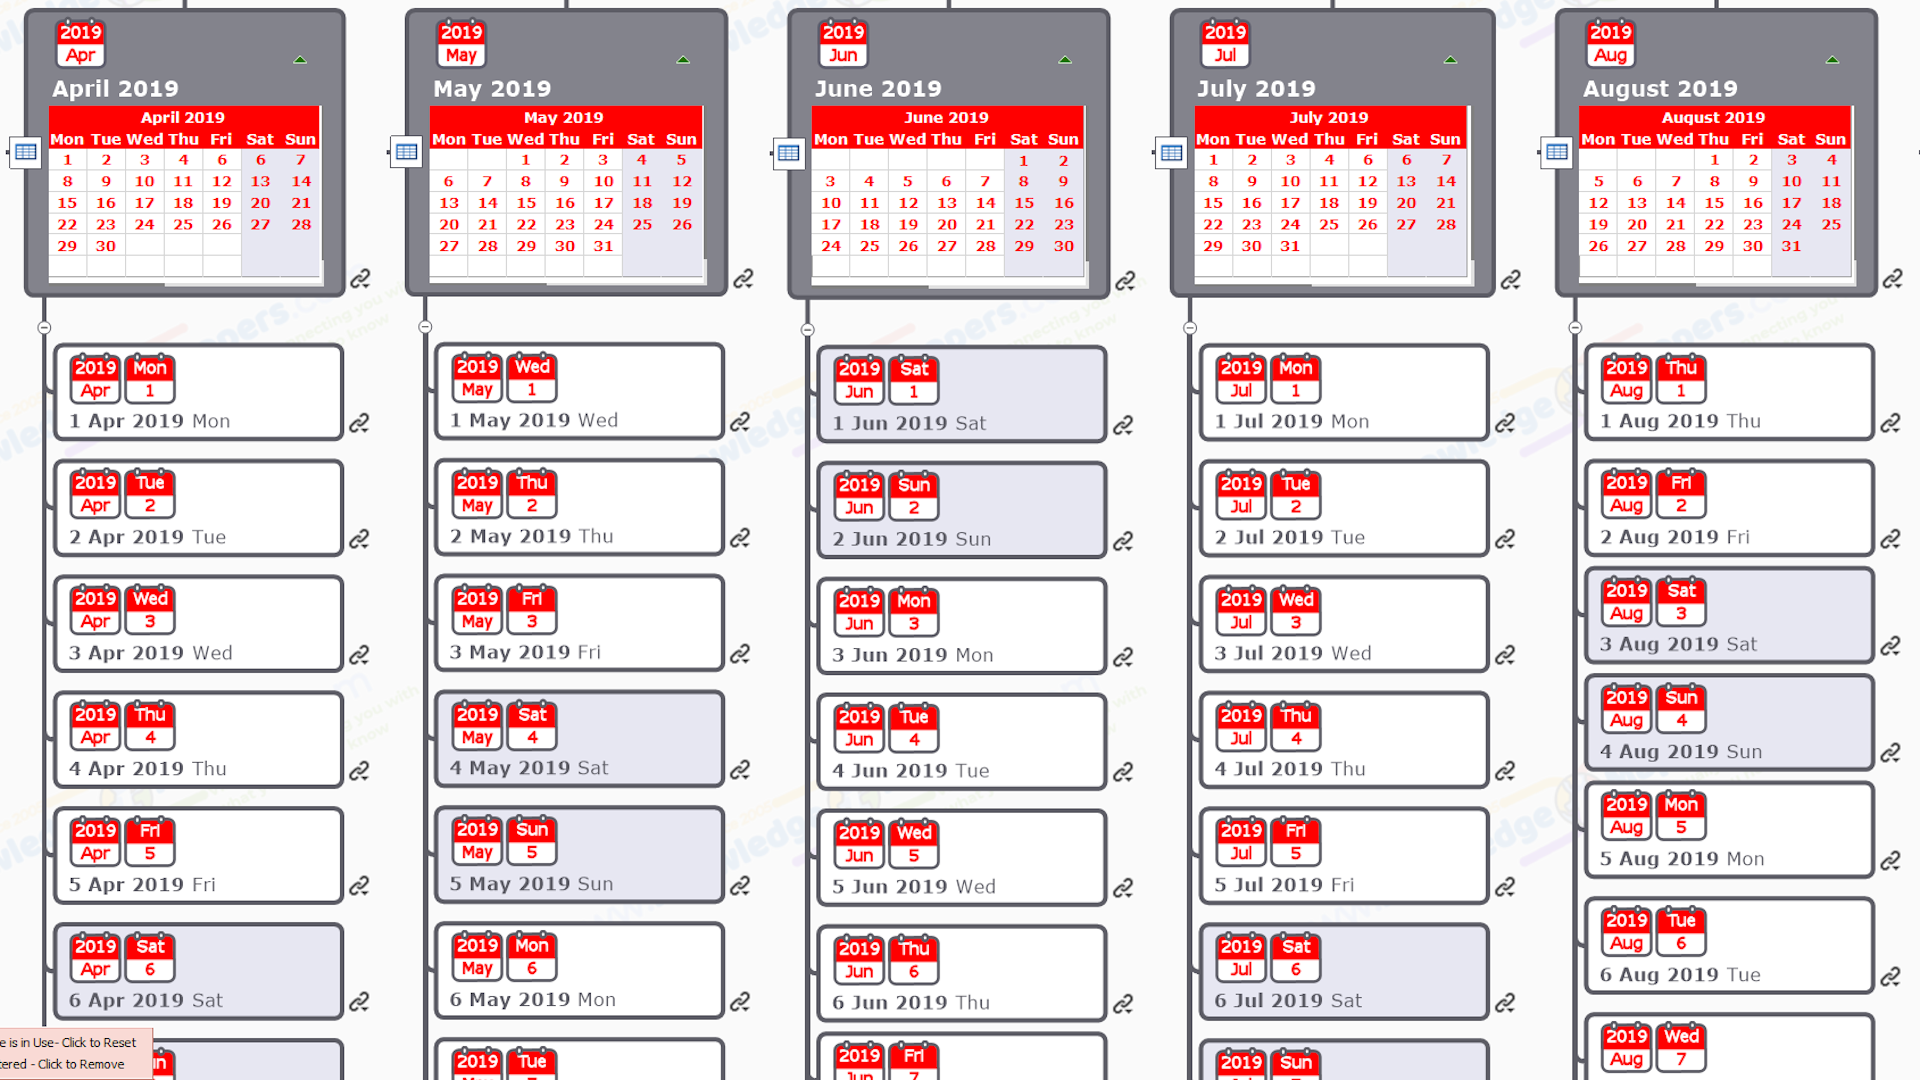
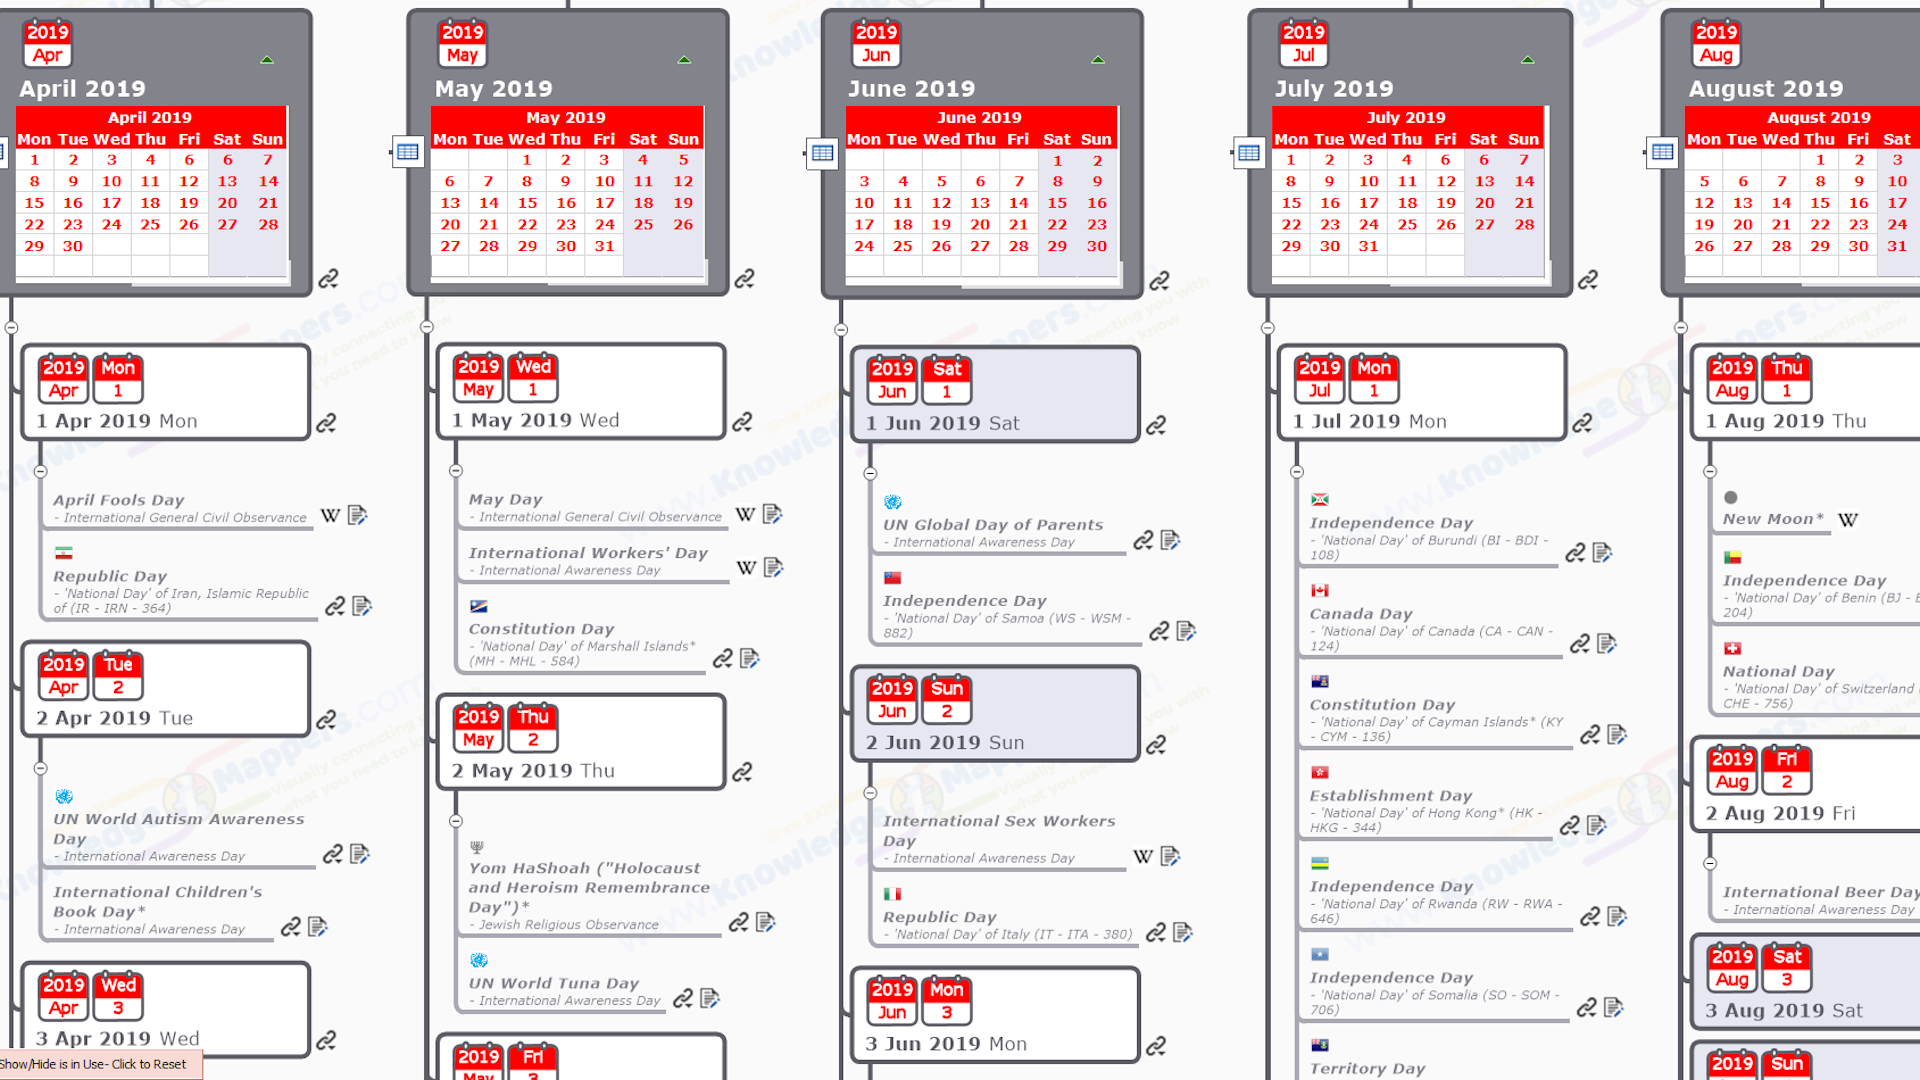
Intrigued, we applied the same technique to the humble calendar – the atlas for ‘time space’ – and, to cut a slightly shorter research & development story short – our calendar knowledge maps were born…
(These also crossed over to the ‘geographic space’ when we added links to the national days of every country of the world, as well as calendars for specific countries…)
Thinking further we realised there’s plenty of ‘things’ in the world of human endeavour that are real, and important, and have hierarchical (and other) inter-relationship with other real, and important, things….
In fact we soon realised that, using this new visual mapping technique , we could map pretty much capture any ‘space’ of human interest and endeavour – be it physical, virtual, conceptual or whatever – as a MindManager map…
In these days of information overload we also realised that our knowledge maps could help people – and the teams, organisations and communities of which they are part – more quickly and easily answer the basic questions about ‘the spaces’ that they spend a lot of their time & resources trying to find answers to…
By discovering & accessing the knowledge they need more quickly (and with a lot less stress :-), they could spend their precious (and usually limited) time & resources actually utilisng it to do what they need to do, rather than scrolling through endless search results (assuming they knew what to look for in the first place of course).
Anybody with access to MindManager software can use our knowledge maps as ‘ready made’ templates to amend, adapt & repurpose (in whole or in part) in their own projects, so they do not have to re-invent the knowledge wheel each time.
However thanks to MindManager’s unique HTML export capabilities, the HTML versions of our knowledge maps can be accessed by anybody using any modern browser, on any device, on or offline, without the need for any plugins ie. everybody!
And so we opened our digital download map store so that anybody can benefit from the ‘universdally useful’ knowledge maps of our world we create, and began offering our knowledge mapping services to map ‘spaces’ on behalf of clients as well as help them to do it for themselves…
After several decades of travel along the ‘Information Superhighway’ (remember that one kids?), lack of information isn’t usually the problem. With most teams / organisation it’s usually the opposite, with information overload slowing down people’s ability to find the specific information they need amongs ‘all the noise’, understand it, and process it into knowledge that they can apply to the task at hand so they can achieve what they want to achieve to move forward.
The first step to taming information and making it work for you is visually capturing it – or at least the definitive sources of it – in MindManager. Once in a map, it can be turned into specific knowledge resources as required.
However knowledge mapping is a journey. Let us help you along the way with consultancy / ‘done for you’ services to get you started working visually with your data / information / knowledge, and then after a while some training so you can do it for yourselves.
Please contact us directly to help you start your knowledge mapping journey.
As part of our ongoing mission to “connect people with the information they need to know using maps (of all sorts)”, we have created public domain knowledge maps of fundamental concepts that humans use to structure and make sense of the world – such as geographic space and time – and then we publish them in the world’s only digital download knowledge map store so that people can more easily structure and make sense of the world, as well as find out the knowledge they need to know about it in order to do what they need to do, quicker easier and with a lot less stress…
Maps are available in both MindManager and HTML5 format so you don’t need to be a MindManager user to get started on your visual knowledge journey. If you do want to take it a bit further though you can easily get hold of a fully functoning 30 day free trial copy of MindManager here. Even if you don’t decide to purchase a licence, it will still work as a free map reader for store maps in MindManager format in perpetuity.
An urgent requirement for a particular public domain information map and it’s not in our store? Please contact us directly to as we may be able to create it and add it to our store inventory (if the information is “out there” to be mapped of course and we think it will add to the public good).
If you have more bespoke knowledge maps in mind, then we can create those for you too…
Perhaps you want map your own knowledge mapped ‘on top of’ one of our already published public domain knowledge maps, in the same way you might add your own data on top of a geographic basemap in a GIS? Or perhaps combine it some other way?
For orgnisations a common starting point is to create an organisation map (using the traditional ‘org chart’ structure) – but down to the level of individual teams and people – which forms the base knowledge framework which can then be taken in many different, specific (and niche) directions, but with everybody ‘singing from the hymn sheet’ as they go.
We can do this for you and create HTML maps or, if you are a MindManager user we can initially do it for you to get you started and then help you to do it for yourself in the future.
Please contact us directly to discuss your bespoke knowledge mapping requirements.
MindManager software was created specifically as an information mapping tool for business users. The rich & dynamic visual framework that it provides enables the information to be seen in context, even at the finest level of detail, in a way that traditional business information tools like spreadsheets just can’t. (See our MindManager Applications page where we have lots of tutorial videos, recorded webinars and other resources that show how MindManager can be applied to just about all areas of business).
Here are just a few ideas to show you the range of business information mapping services we can help you with…
Map your everyday world – Organisations, departments, teams, people networks & communities, assets, documentation – with a single (or a series of connected) knowledge maps serving as a mixture of visually structured digital directory, organisational map, as well as educational and awareness raising resource. These are sometimes called ‘dashboard maps’.
Map organisational knowledge wherever it is before it gets lost – ‘People churn’ is an inescapabale part of any operation, but are they taking vital knowledge with them, or the knowledge of where it is kept, that only they know when they retire to the South of France, leave to work for your rival and / or gets run over by the proverbial bus (are the 2 events connected?).
Map projects and initiatives in real time – Even when stored on Microsoft SharePoint sites, the amount of nodes and files soon mount up without dedicated curation. Maps make it so much easier for all stakeholders to discover / find the knowledge resources they need sooner, as well as raise awareness and buy-in from everybody.
Map data contained in spreadsheets and databases – MindManger integrates with all the programs in the Microsoft Office suite, with inbuilt tools eg. the Excel spreadsheet mapper tool imports the columns you specify from a spreadsheet and turns them into a visually structured tree map, with the data columns added as branches, attached notes or marker tags.
Please contact us directly to discuss your own business knowledge / information / data mapping requirements.
As well as capturing and visualising existing data / information / knowledge, MindManager can be used to facilitate business processes. For example it is the ideal tool for any – and all – parts of the meeting cycle…
Pre-meeting – MindManager can be used to brainstorm meeting content as well as all the logistics around the organising. With a bit of tidying up and linking through to meeting documentation, this ‘agenda’ map can be sent to all participants beforehand. This is especially useful when meetings are called at short notice so there is not much time to create the necessary information resources for participants (such as in the agile way of working).
Running the meeting – The same ‘agenda’ map can be used to actually run the meeting (even if only on the facilitators laptop). As well as keeping everybody on track, ideas and discussions can be visually captured real time as they unfold as sub-branches off (or notes on) the appropriate agenda branch in the map. This will greatly improve participation and engagement of the attendees, and the extra energy generated may even lead on to the formation of some sort of forward looking, structured strategic plan 😉 Or even as far as an operational plan, with tasks assigned to individuals!
Post-meeting – With a bit of ‘tidying up’ and marking up of action points, the same map can quickly be sent out to all attendees afterwards to provide a great interactive record of what happened as well as the next steps they need to take. This will greatly improve post-event engagement. Also as they are digital files, these meeting maps can be easily archived for easy retrieval at any point in the future.
So depending on the style of meeting and how much you want to do yourself, you may need a bit of help doing some or all of this. It’s not always possible to facilitate and lead discussions and listen and type all at the same time! Also you may not have a colleague on-hand who knows their way round mindmapping software. That’s where we come in with our meeting mapping service. Let us…
Please contact us directly to to ensure the next brainstorming / strategising / wash-up meeting between you and your colleagues / clients is a rip-roaring success.
MindManager lends itself especially well to conferences and workshops, which are essentially a series of meetings that are more complex and involved..
As with our basic meeting mapping service, MindManager and our map making and sharing know how can help with all aspects of the pre, during and post conference / workshop cycle.
Please contact us directly to help you ensure that your next conference / workshop hits the mark!
Community mapping is all about empowering communities with the knowledge resources they need in order to move forward with challenges or opportunities they are facing. This is done by connecting them with each other, with what they individually & collectively do know, and with the wider general, and specific, knowledge bases so that they can use their (usually limited) resources to fill in the gaps and not re-invent wheels.
The first task in any community mapping process is mapping the community (ie. defining it visually). This is relatively straight forward when the community is defined geographically (see our Geographic Community Mapping Service), but what about when it isn’t? What about if it doesn’t exist in the physical world at all but is through a common interest/ hobby etc., and exists entirely virtually online? As already pointed out this is not a problem when using MindManager to map communities, the interelationships between members and the component parts.
Once the members can locate themselves on the visual map of the community, the inter-connection and knowledge sharing can begin. This process is greatly accelerated if what knowledge they do possess around the challenge, or is known about it in the wider public domain knowledge bases, is already knowledge mapped and available to the community.
This process of ‘community mindmapping’ is an interactive, iterative one, with the knowledge (and links to knowledge resources) being added to the map over time sparking more collaborative thoughts and ideas and responses to the challenge. As with other exercisies in knowledge mapping it’s up to the participants to decide when the process is finished (“even if it’s just for now”). And where to take it next… As discussed already it’s easy to turn knowledge maps into a plan of action, if that is the desired outcome.
Please contact us directly and let our knowledge mapping skills help your community move forward to meet it’s challenges and opportunities.
Our biggest community mapping project yet, ScotlandTheMap shows the level of detail down to which it is possible to knowledge map…
What do we collectively know about all the ‘national local building blocks’ of Scotland ie. the things that individuals, organisation & communities rely on on a daily basis, and therefore spend a lot of their own time & resources finding out about and keeping up with? Where are the fundamental knowledge resources about them located in the public domian? How can you assess them for quality & suitability? Most importantly, how do you access them now – and in the future – so you can utilise them for the benefit of yourself / organisation / community / project?
ScotlandTheMap is a ground-breaking, national knowledge mapping project virtually connecting general, geographic & specialised knowledge resources about the ‘key building blocks’ of the nation, by visually connecting them in digital knowledge maps. This makes them easier to discover, re-locate, understand & utilise, which benefits resource users, creators, and the nation as a whole.
We achieve this using our unique mix of professional information hunting & cartography skills and MindManager, the world leading information mapping software. The resulting HTML knowledge maps – which you are free to view, download & share on this site – open in any modern browser, on any device, without the need for any plugins.
We welcome your feedback & suggestions for subjects for future maps, or other definitive / official / plain old useful knowledge resources to link to (as long as they’re freely accessible in the public domain). We are also keen to collaborate with like minded organisations, communities & projects for the benefit of the common good.
Want us to do something similar for you? Please contact us directly and let us knowledge map your ‘national local’ building blocks.
In our experience there are very few areas of human endeavor that don’t benefit from the increased understanding, buy-in and alignment that working visually with the data / information / knowledge you need brings. Here are some of the reasons why you should ask us to help you start realising those benefits…
Not only are we the No 1 company creating & publish knowledge resource maps and providing 'done for you services' as well as consultancy & training for you to do it for yourself we are the only one!
We have decades of collective professional experience of all aspects of the sourcing, creation, analysis & sharing of information to provide meaningful insight to stakeholders.
As one of MindManager's International Value Added partners we feed in to the Beta development program and can draw from a huge pool of knowledge to help you get the most from the world's best information mapping software.
With the capacity for 1000’s of branches, multiple hyperlinks per branch, embedded data features - spreadsheets, charts & auto-calculated topic properties - rich text formatting, and an extensive range of topic shapes & map layouts, we can visually connect the knowledge resources of your world.
Mapping enables you to visually connect individual knowlegde resources into virtual collections, and collections into virtual librariries to make them as accessible as possible, by as many people as possible, using standard office tools.
Working visually helps you make connections & gain business-intelligence insights you didn’t have before. Identify what you need to do to move forward, and crucially get it done, quicker, easier and with a lot less stress!
From the UK Chief Medical Officer to Local Council Officers, Project Managers and Headmasters, our mapping products and services have connected many individuals, teams, organisations & communities with the knowledge they need to get done what they need to get done… quicker, easier, and with a lot less stress 🙂
In our experience much time & energy is wasted by individuals, organisations & communities hunting for the knowledge they need about Scotland and it’s component parts (it’s ‘national building blocks’), especially at the sub-national level. 1000’s of ‘person hours’ are spent every day floundering around down online search ‘rabbit holes’, painstakingly piecing together the ‘big picture’ from individual knowledge resources scattered around the web, or even creating ‘new’ knowledge resources because they couldn’t find what they were looking for (even though it may already exist)…
And that’s just the time that’s wasted. If the knowedge is crucially required in order for people to fulfill their day-to-day tasks today – which includes operationally planning what needs to be delivered tommorrow, and strategically thinking about what could be in the future – then it’s wasting a lot more other resources too…
In our humble opinion people should be spending their time better actually utilising the knowledge resources that currently do exist – or identifying the gaps where new ones are needed – so that they can better do what they need to do, and progress themselves and their organisation / community / project.
Any tool or technique that makes the knowledge gathering, assimilation & utilisation process quicker, easier and less stressful for all concerned can only be welcomed, and can only benefit the nation as a whole.
Enter the’knowledge map‘ – a single, visually rich, information dense, hierarchically structured, intuitive to navigate, easy to share, ‘clickable index’ document…
“Och everything’s online now, all you have to do is Google it…”
There’s no shortage of knowledge resources about Scotland out there in the online, public domain. And sure, if you only need to find out a couple of facts in isolation now and again, a Google search will probably do it for you – as long as the answer you need is on the first few pages of the 8 million search results returned 🙁 (otherwise you may lose the will to live before you find the ones you need, or indeed reasonably conclude that the knowledge you seek does not currently exist, at least in the searchable pubic domain).
However if you regularly need to find a lot of information out in a more sustained, systematic way, AND record the existence of those new knowledge resources so you can return to them again later, AND build on the newly acquired knowledge they give you now – as is the case in doing desktop research for work and/or personal projects – then you will know what a frustrating & time consuming way of doing things a Google search is, especially if you are starting off from a ‘zero knowledge base’ yourself…
So, so many results to wade through… Results not all presented in order of relevance or importance to you… Resources linked to in different digital formats (eg. webpages, some buried in report documents without internal links, and what about all that data in downloadable spreadsheets?)… Dozens of browser tabs open because you don’t have a robust system of logging a ‘useful’ resource once you’ve found it so you can go back to it later…
We’ve all been there, so what’s the solution?
Digital knowledge mapping using MindManager software is the only technique we know of that can simultaneously record the existence of potentially 100’s of real world ‘things’, 1000’s of knowledge resources about them, the ‘big picture’ contextual relationship between them and in which they are found, and ‘where they are’ online (ie. their ‘URL’).
AND do it in a very intuitive way, with a short learning curve, both in terms of making & sharing a map with software, and understanding it so that you can use it to find out what you want…
AND do it using ‘every day’ digital tools found in most office setups, making the requirement for further investment in technology minimal…
AND in a way that actively engages with more bits of your brain than traditional, linearly structured knowledge resources…
AND in a way that is able to cope with the real world as it is, in all it’s well intentioned, information overload, messy, ‘fuzzy logical’, glory…
A map encodes & conveys information visually, but crucially does so in a structured way using cartographic principles & devices. So utlises such elements as visual hierachies (more visually prominent things are more important), lines showing hierarchical relationships between things (equivelant to or a subdivision of?), shapes, symbols (ie. visual metaphors), meaningful colours (eye-catching, complementary & contrasting) etc., all in conjunction with a minimal amount of text (which too is visually formatted using the same cartographic principles).
Together all these elements create a visually structured framework of knowledge that more actively engages with your brain than a linearly structured, text-only knowledge resource does, and so it is more easily navigated, understood and assimilated.
A map is also just a ‘visually structured index’ of what ‘things’ exist in a particular ‘space’, and the relationships between them within it – a particular (& valuable) type of knowledge resource in it’s own right (as Google Maps know only to well).
However unlike a ‘traditional’ geographic map, a knowledge map need not be confined to showing only ‘things’ that exist in geographic space. Yes they can show those – and our ScotlandTheMap knowledge maps most definitely do – but they could equally be ‘man made constructs’ that exist in our ‘conceptual space’, such as ‘organisations / bodies’ or ‘sectors’ or ‘networks’ or ‘communities’ or ‘partnerships’ or ‘governments’, or any other number of the ‘real world things’ we create to structure our societies and help us run them on a day to day basis.
Equally the ‘things’ they can map may only exist in a virtual space like the world wide web – which is already hierarchically structured into websites, pages, sub-sections and downloadable files along with some sort of associated human navigation system. So ‘things’ like online knowledge resources about the ‘real world things’ in geographic or conceptual space…
Combining both concepts of ‘spaces’ in the one knowledge map creates a visually structured index of knowledge resources about real world things, that is visually (and therefore virtually) connected to a visually structured index of the real world things themselves…
And if the digital knowledge map included the URL of those online knowledge resources, it would not only be a visually structured index of the resources that existed about all the real world ‘things’ of a particular type, it could take users straight to them with a single ‘mouse click’ on a hyperlink.
Then our knowledge map becomes a visually structured portal to – rather than simply an index of – knowledge resources.
As well as attaching hyperlinks to external knowledge resources, information mapping software has a range of ‘information cartography’ features that (in the hands of the right map-maker) enables general, contextual knowledge elements to be visually embedded within branches in the map.
Such embedded knowledge can be in the form of imagery – real life photos of people or places etc., or screenshots of ‘knowledge pictures’ like geographic maps (eg. boundary maps).
Or they could be in the form of traditionally structured data devices like spreadsheets or charts. They could also be individual data fields, the values of which can be used to visually format individual branches eg. assigning a fill colour (the same way the ‘thematic mapping’ process colours in areas by value in geographic maps).
Branches can also be individually tagged with attributes, and the tags used to perform simple querying that hides / shows only those branches that fulfill defined criteria in a search (the same as in the ‘geo-filtering’ process used with geographic maps).
By visually incorporating such embedded and attached knowledge about national building blocks into the map, the need to even look up other knowledge resources is much reduced, thus saving even more ‘person hours’ that could be better spent progressing the individual, organisation or community.
As the virtual library of maps of the fundamental building blocks of the nation and the knowledge resources about them grows, it becomes apparent that many of them (in whole or in part) could be re-used to provide a ‘base knowledge framework’ upon which further ‘layers’ of more specialised knowledge branches can be added. So for example our Scottish Local Councils – General & Geographic Knowledge Atlas provides a base framework for our Scottish Local Council Electoral Wards – General, Geographic & Electoral Knowledge Atlas, which in turn forms a base framework for our Scottish Local Councils, Electoral Wards & Local Councillors – Political Knowledge Atlas.
This process is akin to the one used to build up geographic maps in an online mapping viewer or a GIS, where a general basemap – such as those provided by Open Street Map, Google or Ordnance Survey – provide a general spatial context for additional ‘layers’ of more specific geospatial data (the ‘points, lines & polygons’) that are displayed on top it.
Thus a well-constructed general knowledge map can be re-purposed to make any number of more focused maps in the future without having to ‘start from scratch’, or ‘re-invent the wheel’ every time…
The videos above provide overviews of the maps produced so far by the Scotland The Map Project…
Please share this page with your networks and others you think will benefit from our visual working.
Groundbreaking Geographic & Knowledge Mapping Products & Services that visually connect individuals, teams, organisations & communities with what they need to know… so that they can do what they need to do… quicker, easier and with a lot less stress :-)
Powered by WordPress, GeneratePress Theme & Elementor Page Builder
© Copyright 2005-24 – Knowledge Mappers Limited – Registered in Scotland – Company Number SC278136